By all appearances, the weak La Niña event across the Equatorial Pacific may be at its maximum strength, with steady weakening trend anticipated throughout the remainder of the winter according to both statistical and dynamical models used to predict its onset and end. This is not earth shattering news because the statistical peak of past La Niña and El Niño events are centered on the month of December. What remains to be determined is how atmospheric patterns across North America respond to La Niña conditions ending heading into the 2022 spring period.
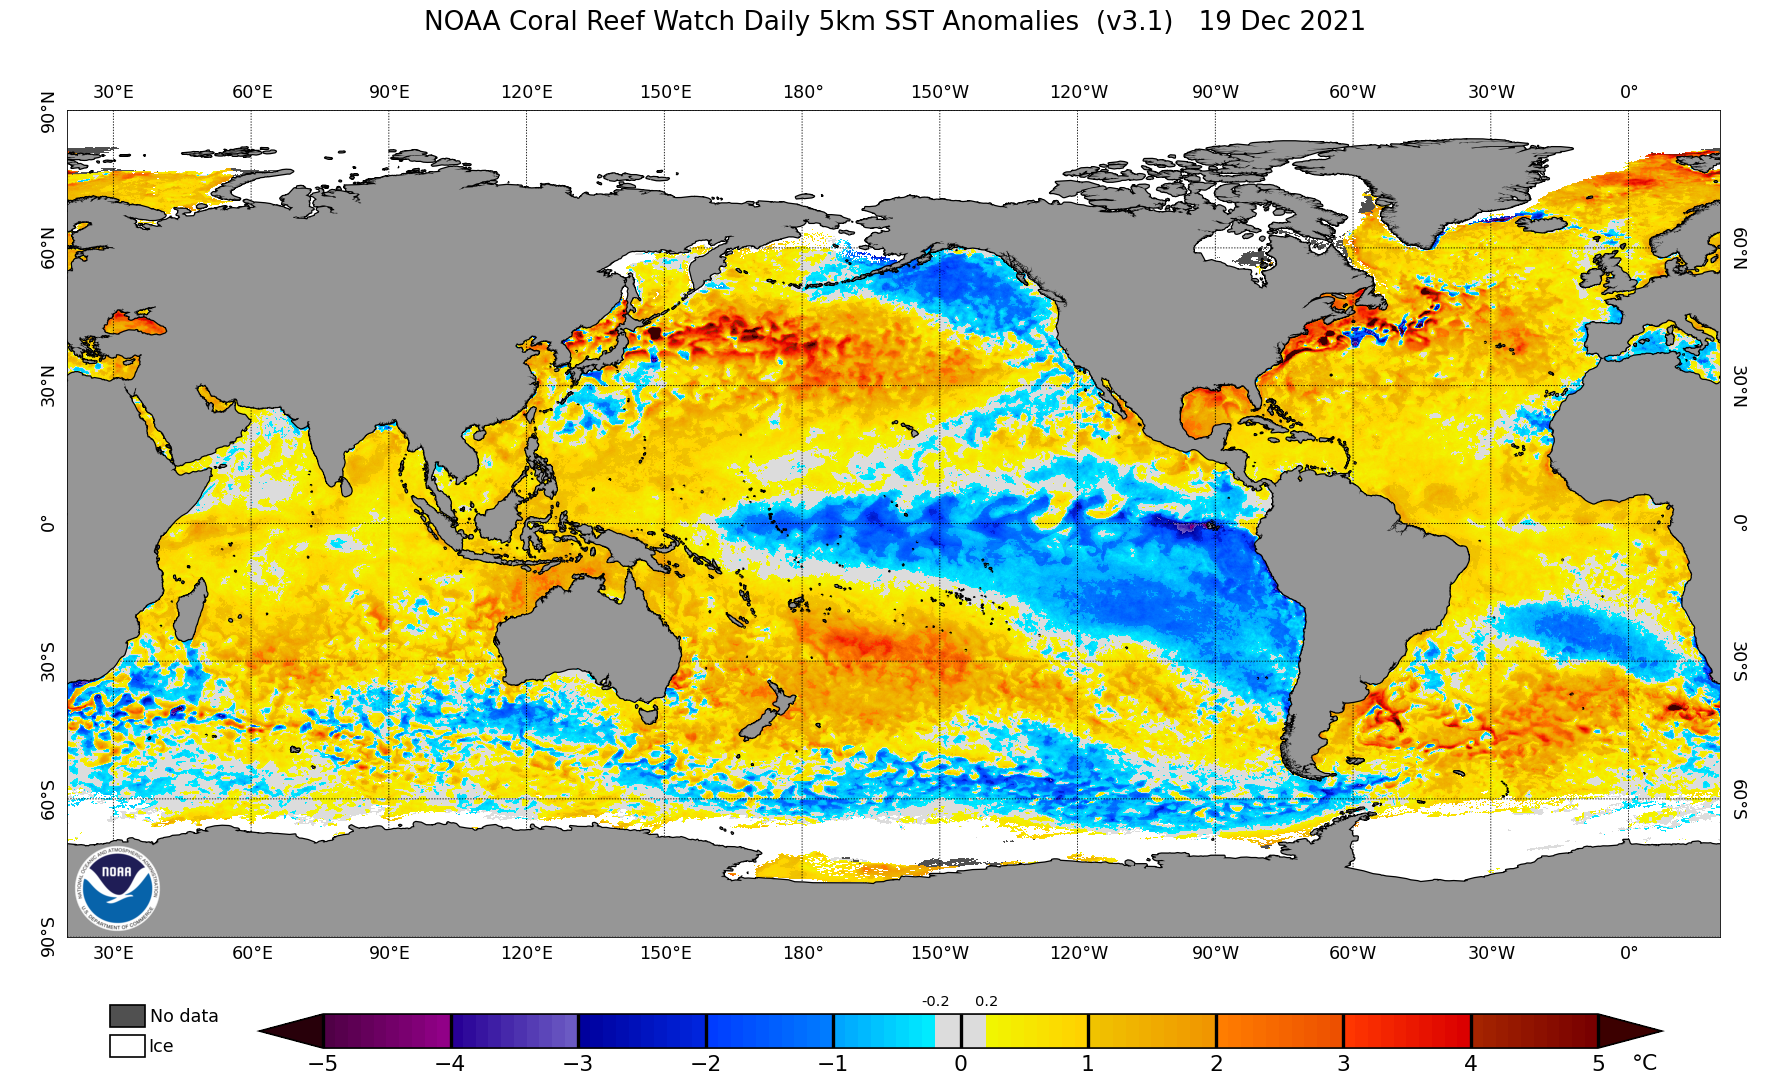
Figure 1 depicts the current global sea surface temperature anomalies on December 19th. Several obvious patterns can be found in Figure 1 including cold anomalies in the Gulf of Alaska, the eastern 2/3 of the Equatorial Pacific and along the west coast of South America. Warm anomalies are pronounced across the mid-Pacific regions of the northern and southern Pacific Ocean regions. It is these warm anomalous regions that will likely play a key role in regards the longevity of the current La Niña event, as well as the eventual storm tracks for the remainder of this winter and into next spring.
Surface support for the current La Niña signal (influx of colder than normal sea surface temperatures) generally comes from three sources: water from the Gulf of Alaska moving southward along the west coast of North America, the melt water from Antarctica moving northward along the west coast of South America and the return current underneath of the Equatorial Pacific. What is apparent from Figure 1 is that the cold surface anomalies from the Gulf of Alaska and the west coast of Antarctica have been cut off by warm anomalies in the northern and southern mid-Pacific region.
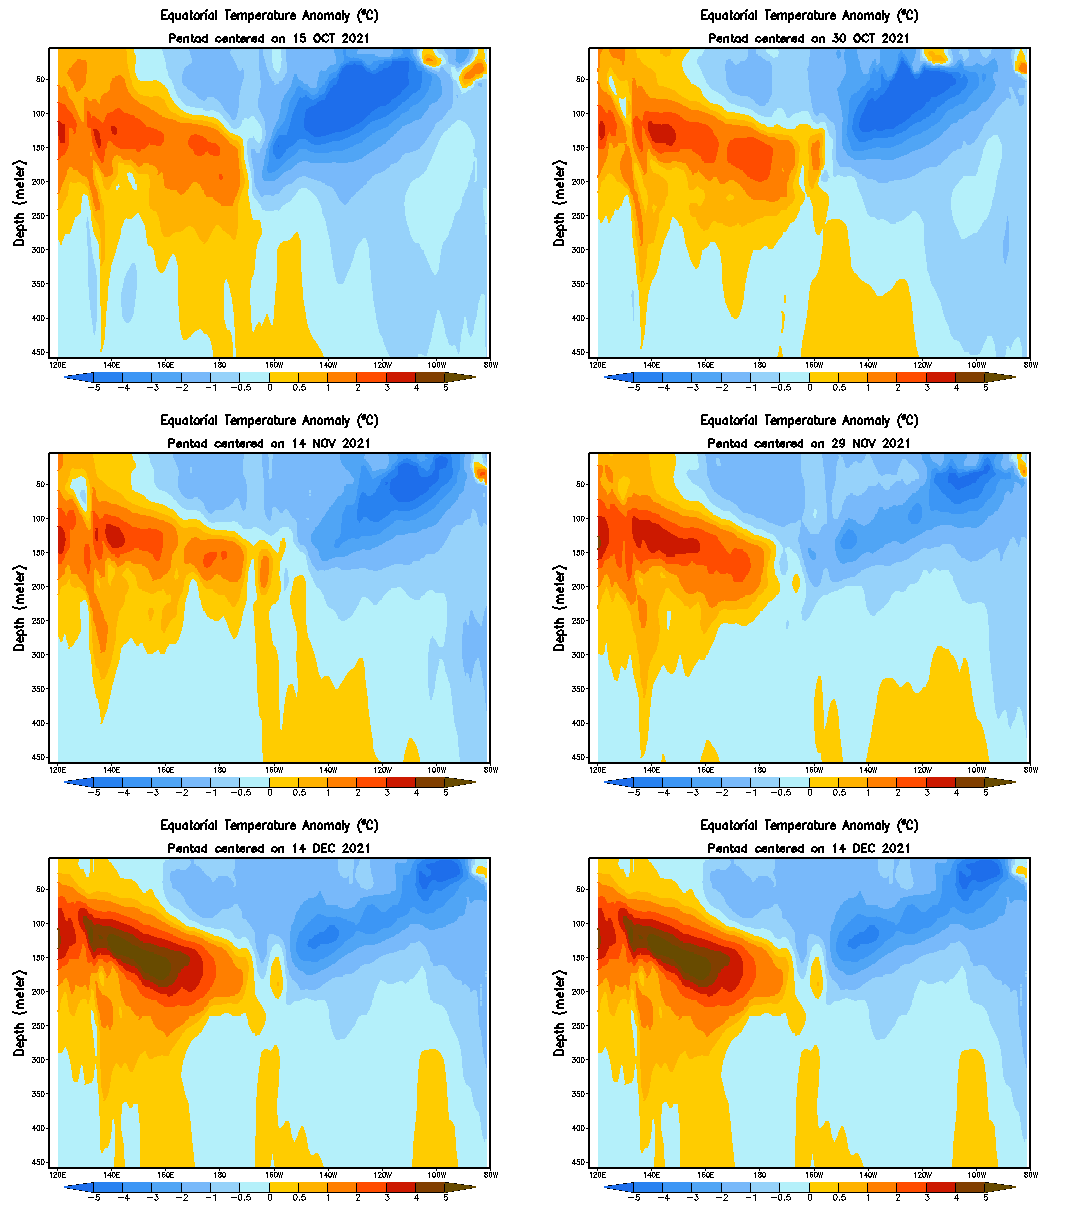
With cold surface anomalies feeding the Equatorial Pacific region dissipating, the current La Niña signal is being supported by sub-surface cold anomalies working their way to the surface in the eastern half of the basin (Figure 2). The animation of this current indicates that a strong pocket of warm water exists below the surface in the western basin and has begun to intensify over the last 30 days. Across the eastern basin, the most significant cold anomalies are working toward the surface and there are much weaker anomalies under the central Equatorial Pacific.
Based upon the movement of water under the Equatorial Pacific in combination with the weakening inflow of colder than normal surface currents, it appears that the current La Niña event is near its peak strength and will begin to weakening as the calendar turns to January. How rapidly La Niña conditions weaken will likely be driven by the speed and strength of the sub-surface warm pool building eastward from its current position under the western basin of the southern Pacific Ocean.
According to the consensus of models used to predict La Niña and El Niño events (Figure 3), the average of the dynamical models(red line) move into neutral conditions (+0.5 C to -0.5 C) during the February-March period, while the average of the statistical models (green line) move into neutral conditions during the March-May period. Since this La Niña event is considered to be weak, I would lean toward the dynamical model average as a better forecasting tool to predict the official end of the event.
The northern jet stream that is the dominate factor in our winter weather across North America typically is stronger during La Niña conditions, while the southern jet stream is weaker. On average this leads to higher probabilities for wetness across the Pacific Northwest, northern Rocky Mountains and the Ohio River Valley. There will be exceptions to this rule (like last winter) where the southern jet stream becomes the primary driver of weather systems crossing the United States (about 25% of the time) when La Niña conditions exist.
This past fall through the beginning stages of this winter have seen an absence of the southern jet stream consistently moving storm systems south of the northern half of the High Plains region. In short, the northern jet stream appears to the dominant mechanism driving storm systems across the Continental United States, but has yet to pull strong Arctic air intrusion southward out of northern Canada.
The lack of cold air penetration into the continental United States may be why the central and northern Plains region (NE, SD, ND) are depicted with no discernible trend for temperatures and precipitation during the January-March period (Figures 4 and 5). Anomalous cold that had been predicted for this winter by the Climate Prediction Center (CPC) in October continues to be forecast for the northern Rockies and Pacific Northwest, with above normal warmth likely across the southeastern half of the United States during the January-March period. Wet anomalies are forecast for the Pacific Northwest and Ohio River Valley, with dryness forecast for the southwest, southern Rockies and eastern half of the southeastern United States.
The Pacific Northwest southward through the northern third of Sierra Mountains in California have been exceptionally wet the past two months, in large part because of several strong atmospheric river events that have occurred in conjunction with upper air lows moving from the Gulf of Alaska onto the west coast of the United States. Much of the precipitation that fell across eastern Nebraska during the second half of October was tied to the northern California atmospheric river event. Blizzard events across the eastern Dakota’s and Minnesota during the last 45 days can be tied to several atmospheric river events that hit the state of Washington and southwestern British Columbia.
The importance of these atmospheric river events is that are associated with strong upper level low pressure systems that have enough energy to quickly strengthen once they move east of the Rocky Mountains. With dry and warm conditions across the southern Plains this past fall and below normal temperatures north of Canadian border, this strong temperature gradient has helped increase the intensity of surface low development east of the Rocky Mountains. Add a little moisture into the lower layers of the atmosphere and the perfect ingredients come together for severe weather outbreaks and/or blizzard activity.
So the underlying question is if or when the cold air bottled up over North America will spill southward into the continental United States. There are signs from short range models that once we move into the final week of December and first week of January that Arctic air will build southward into the western half of the United States in response to a powerful upper air low moving from the west coast into the central Plains.
With drought conditions firmly in place across the western third of Nebraska and below normal fall precipitation across the central third of the state, the best scenario going forward would be that a protective blanket of snowfall will materialize prior to the arrival of Arctic air. Otherwise, surface freezing would limit/eliminate the ability of soil surfaces to absorb melting snowfall.
Even if we do get Arctic air penetration, there have been no signs since our fall season began that the atmosphere will lock into a set pattern for multiple weeks at a time. Therefore, it is probable that any Arctic air intrusions will give way to above normal temperatures once upper air trough responsible for pulling this chilly air southward moves toward the eastern third of the United States. The southerly wind flow at the surface would on the backside of surface highs that follow the upper air troughs responsible for these Arctic blasts.
Bottom line: My thoughts on our winter patterns have not changed since I released my winter outlook in late November. If anything has changed, it is that the strength of systems emerging east of the Rocky Mountains recently are even stronger than the impacts felt from the string of storms crossing the nation’s midsection the second half of October. If the large temperature variations between the southern Plains and southern Canada continue, then systems that do develop will likely remain on the strong side. Subsequently, temperature variability from now through the first half of this coming spring will likely remain high with distinct periods of above normal and below normal temperatures interspersed with an occasional strong storm system capable of producing heavy snowfall and high winds, particularly north of the I-80 corridor.
Al Dutcher, Agricultural Extension Climatologist, Nebraska State Climate Office


