The Climate Prediction Center (CPC) issued their updated ENSO alert November 12th , which indicates that there is a 95% probability that La Niña conditions will continue through the winter and a 65% probability conditions will continue through the spring of 2021. The La Niña region 3.4 is used to determine the event strength and the current average is 1.3 C below normal. This event is just shy of “Strong” classification, which requires the 3-month average of the La Nina 3.4 region to be at least 1.5 C below normal.
Sea Surface Temperature (SST) anomalies clearly depict the current La Niña temperature anomaly in Figure 1. Below normal SST's extend from South America to just east of Polynesia along the Equatorial Pacific. Below the surface colder than normal water is pooled from the central Pacific to the South American coastline (Figure 2). Currents below the Equatorial Pacific show a strong cold pool moving to the surface which should reinforce or strengthen La Niña conditions over the next 30-60 days.
Ultimately, the length and strength of this event will be determined by how quickly the strong above normal sub-surface temperature anomaly under the western Equatorial Pacific can move into the eastern Pacific. During the last 30 days there has been little eastward movement, but the sub-surface temperature anomaly has increased in intensity. In addition, Gulf of Alaska SST anomalies are beginning to reflect the impacts of upper air troughs feeding on warmer than normal SST’s. The Gulf of Alaska warm surface anomaly has been pushed southward over the last 30 days and below normal surface SST’s have started to appear along the Pacific coastline from Alaska to central California.
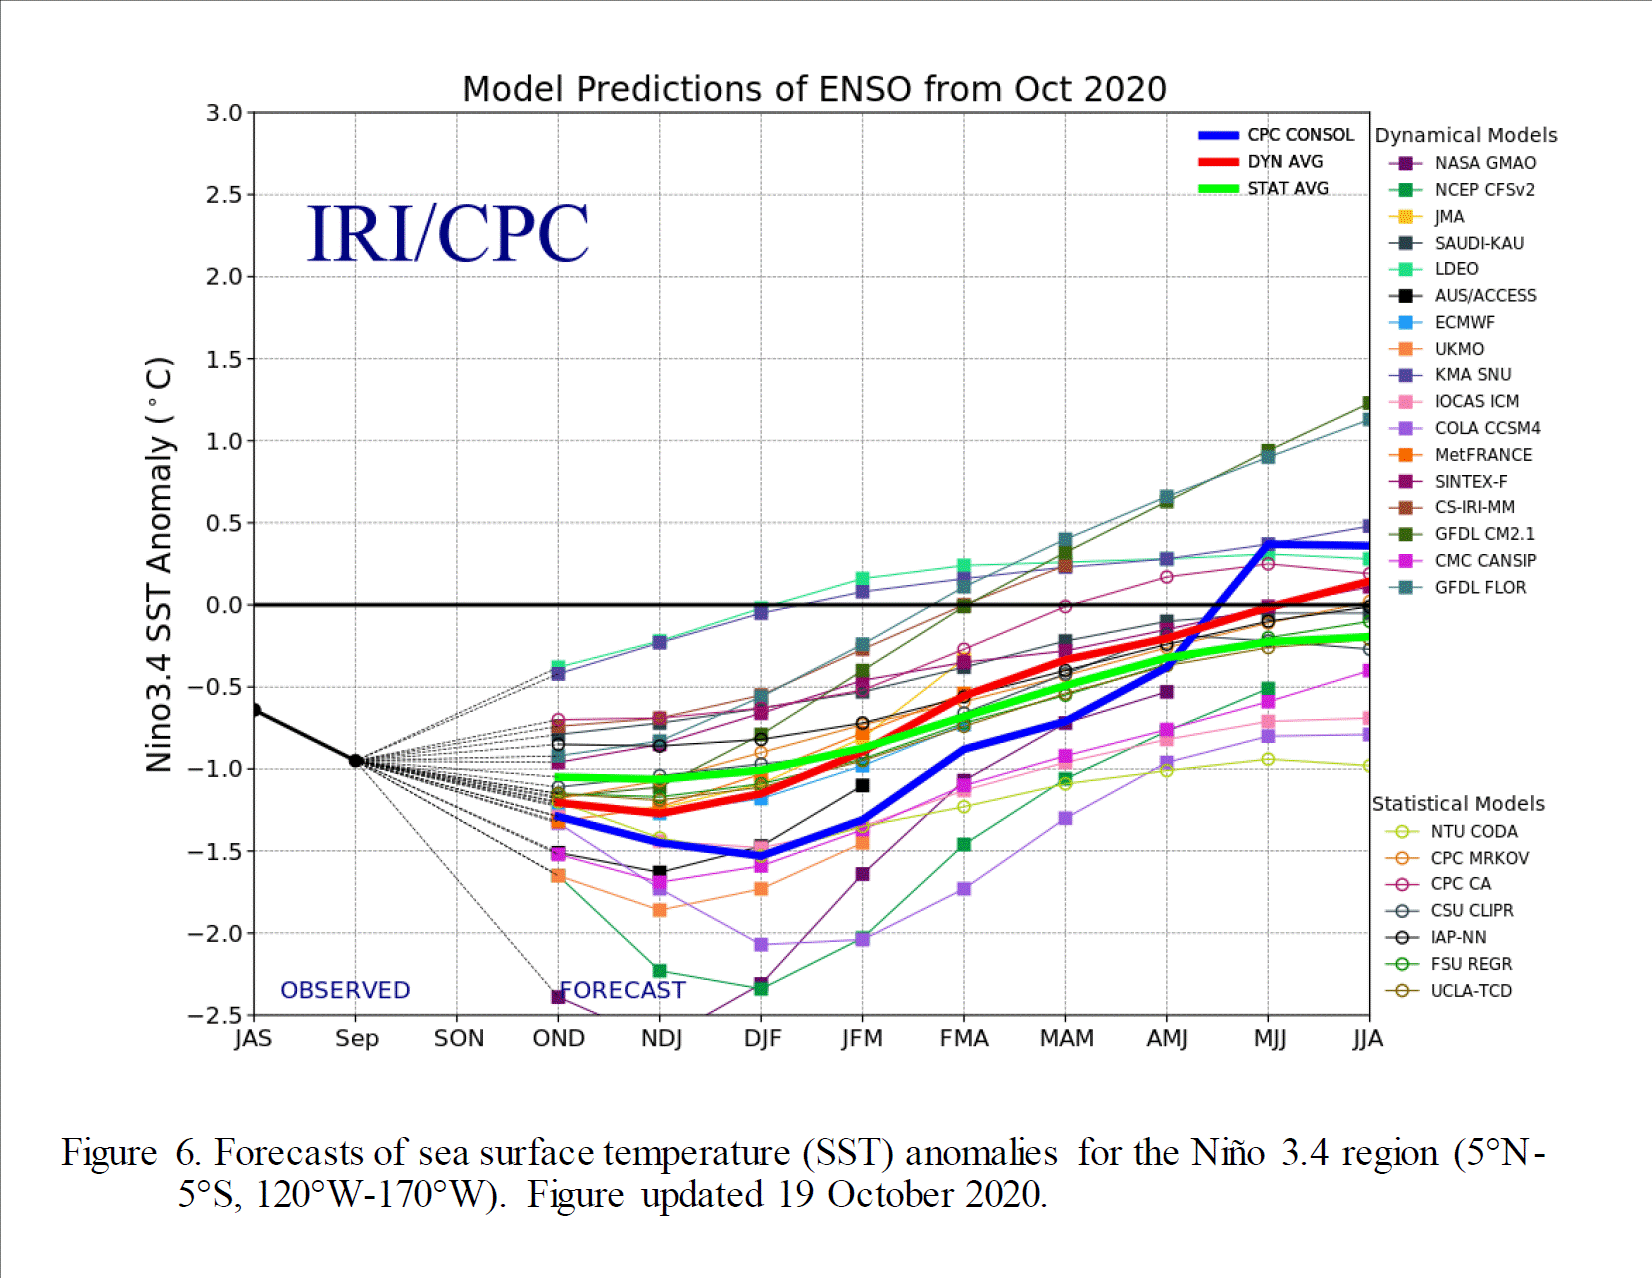
The Gulf of Alaska SST anomalies over the next few months will be crucial in determining whether this La Niña event lasts into a second year. Global models (Figure 3) indicate that this event will not go into a second year, outside of the coldest models. If SST anomalies across the eastern half of the Gulf of Alaska can continue to turn colder and last into the spring, the currents running southward along the Pacific coast could help reinforce surface cooling in the eastern Equatorial Pacific from the northern side. Most of the support for colder surface SST’s has come from the southern side of the Equatorial Pacific.
The current December through February outlook issued by CPC continues to support a La Niña signal. There has been very little change in the official winter forecast issued in October and last weeks updated December–February forecast (Figure 4 and 5). There has been a small adjustment northeastward of the below normal moisture outlook for the central Plains as the northern extent of the October forecast has been moved northeast to include northeastern Kansas and southeastern Nebraska. Further east, CPC did increase the probability of above normal moisture across the eastern corn belt (Indiana and Ohio), which is an area that has a strong wet bias (> 70%) during La Niña episodes.
Even through the winter forecast remains essentially unchanged, CPC did increase the probability for below normal conditions in the late winter and early spring months. CPC places the peak southerly placement of below normal temperature probabilities in the February-April period (Figure 6). Unfortunately, below normal moisture is in CPC’s forecast for the central Plains by expanding the probabilities for below normal moisture across southern Nebraska in the December-February forecast to the entire state in the March-May forecast (Figure 7).
The intensification of dryness probabilities across the southern Plains, while increasing below normal temperature probabilities across the northern Plains during the spring months, is consistent with La Nina events that are still ongoing during the spring months. The good news is that as La Niña events fade, atmospheric jet stream patterns usually return moisture to the central Plains in the May and June period. CPC favors this solution in their growing season outlook. Above normal moisture is anticipated from the late spring through the early fall from eastern Nebraska into the eastern corn belt.
This will be a trend to watch in the updated monthly CPC temperature and precipitation outlooks this winter. If the wet late spring and summer trend remains in place, it would be a clear signal that CPC believes the La Niña impacts will fade by the beginning of next summer. If CPC begins to back away from this wet anomaly over the next 3 months, it would signal to me that La Niña conditions are likely to hold on for a second year. With extensive drought conditions in place across the state, a movement away from above normal moisture prospects in May and June would signal that drought conditions will be slow to subside and possibly strengthen further when crop moisture demands peak during the middle of the summer.
Source: Al Dutcher, Agricultural Extension Climatologist, Nebraska State Climate Office


