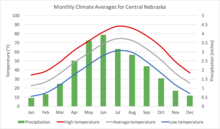
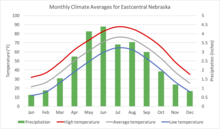
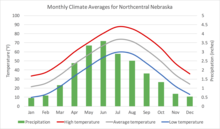
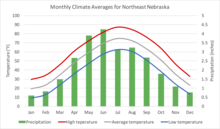
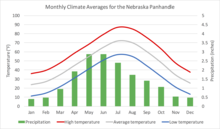
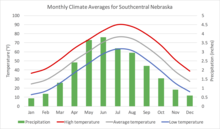
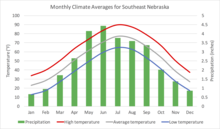
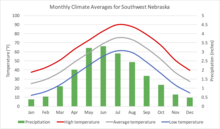
Climographs are simple graphics showing a location's monthly average temperature and monthly average precipitation for a one-year period. The two variables are shown as a line graph and bar chart together. The averages are compared to the prior 30-year average, a benchmark in in climatology.
