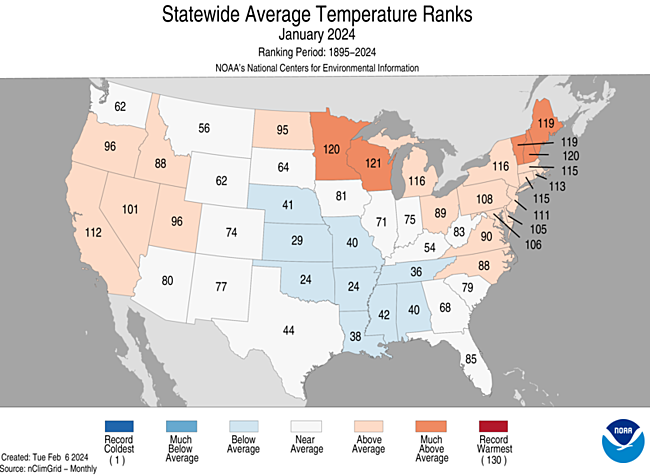
Coldest January since 2011
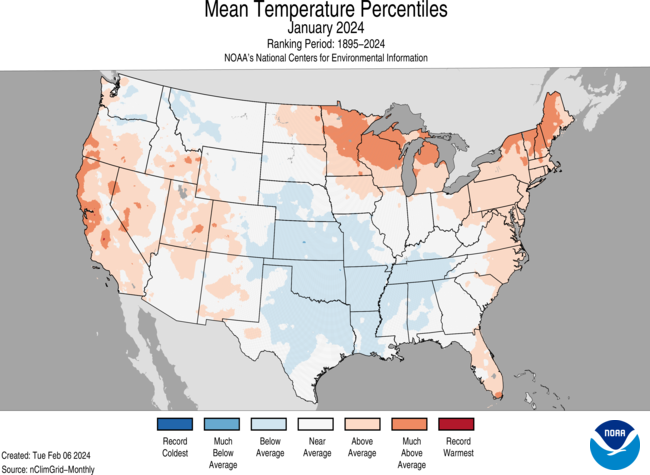
The average temperature in January 2024 was 20.9F, which is 1.2F below the 20th century average of 22.1F. This was the 47th coldest January but the first January below the 20th century average since 2011 and only the fourth below the 20th century average since the mid 1990's. A map of temperature percentiles shows that the east central and northeastern sections of Nebraska, where temperatures are traditionally coldest in January, were around the long-term average and below average almost everywhere else.
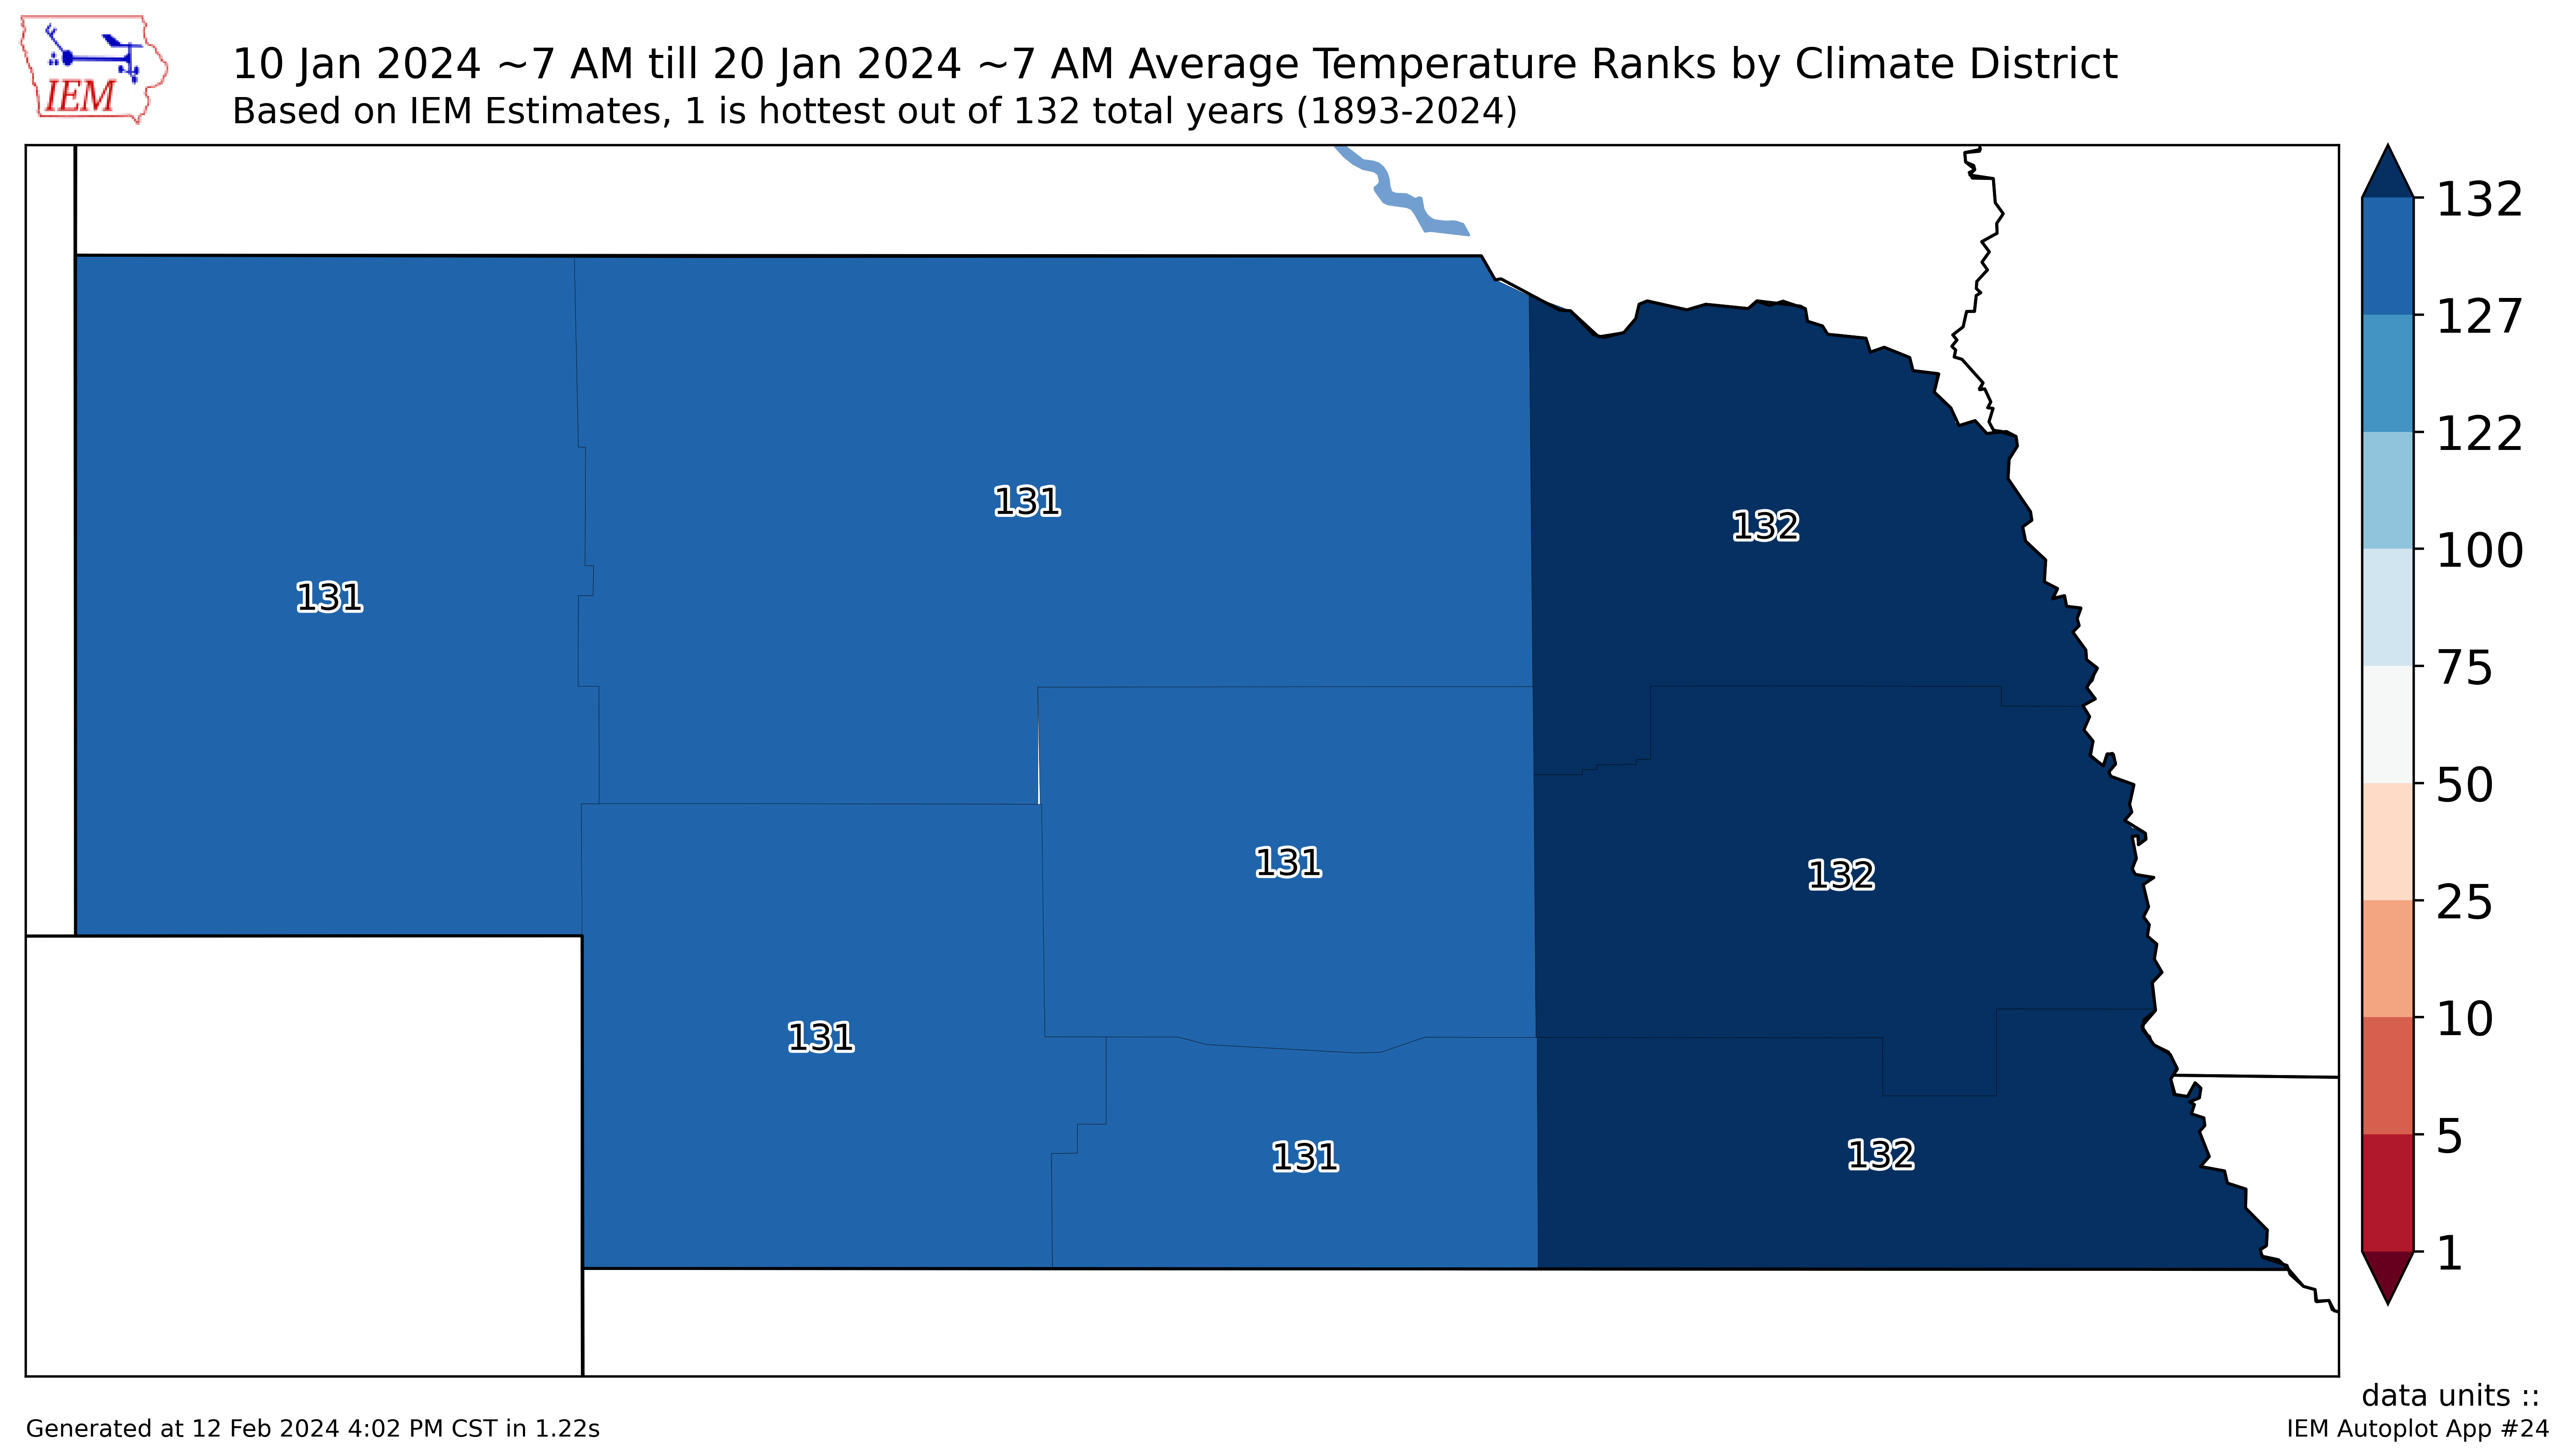
Polar Vortex Yoga
The cold temperatures were the result of a prolonged period of polar vortex stretching, which led to very cold temperatures across the state between the 9th and 21st of January. At its peak, between the 12th and 16th, some parts of north central and northeastern Nebraska spent 100 consecutive hours below 0. Every location in the state had at least one day with subzero maximum temperatures and many locations had multiple days of subzero maximum temperatures. Minimum temperatures dropped to 20 below for much of the state, with some locations setting daily record low temperatures (both maximum and minimum) between the 13th and 16th. The period between the 11th and 20th was the coldest or second coldest on record for many crop reporting districts in the state.
Heavy snowfall
The extreme cold was preceded by significant snowfall across much of eastern Nebraska, with some places picking up well over a foot of snow between the 8th and the 13th. After the thaw began the week of January 22nd, there were several days of fog across the eastern half of the state. This kept maximum temperatures around seasonal averages but kept minimum temperatures well above average. The month finished warm with temperatures well above average across the state and the remaining snowfall melted.
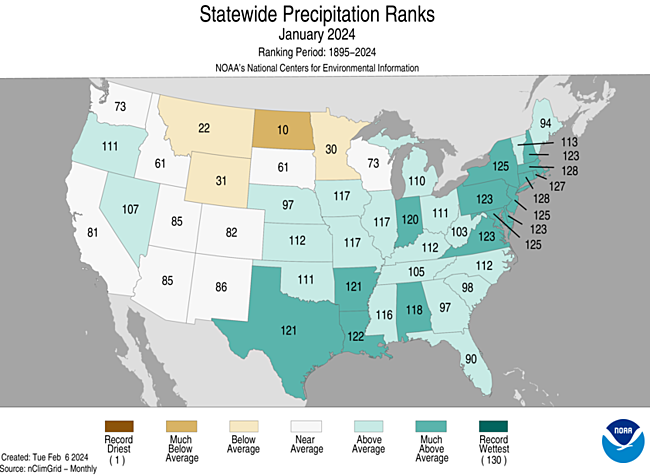
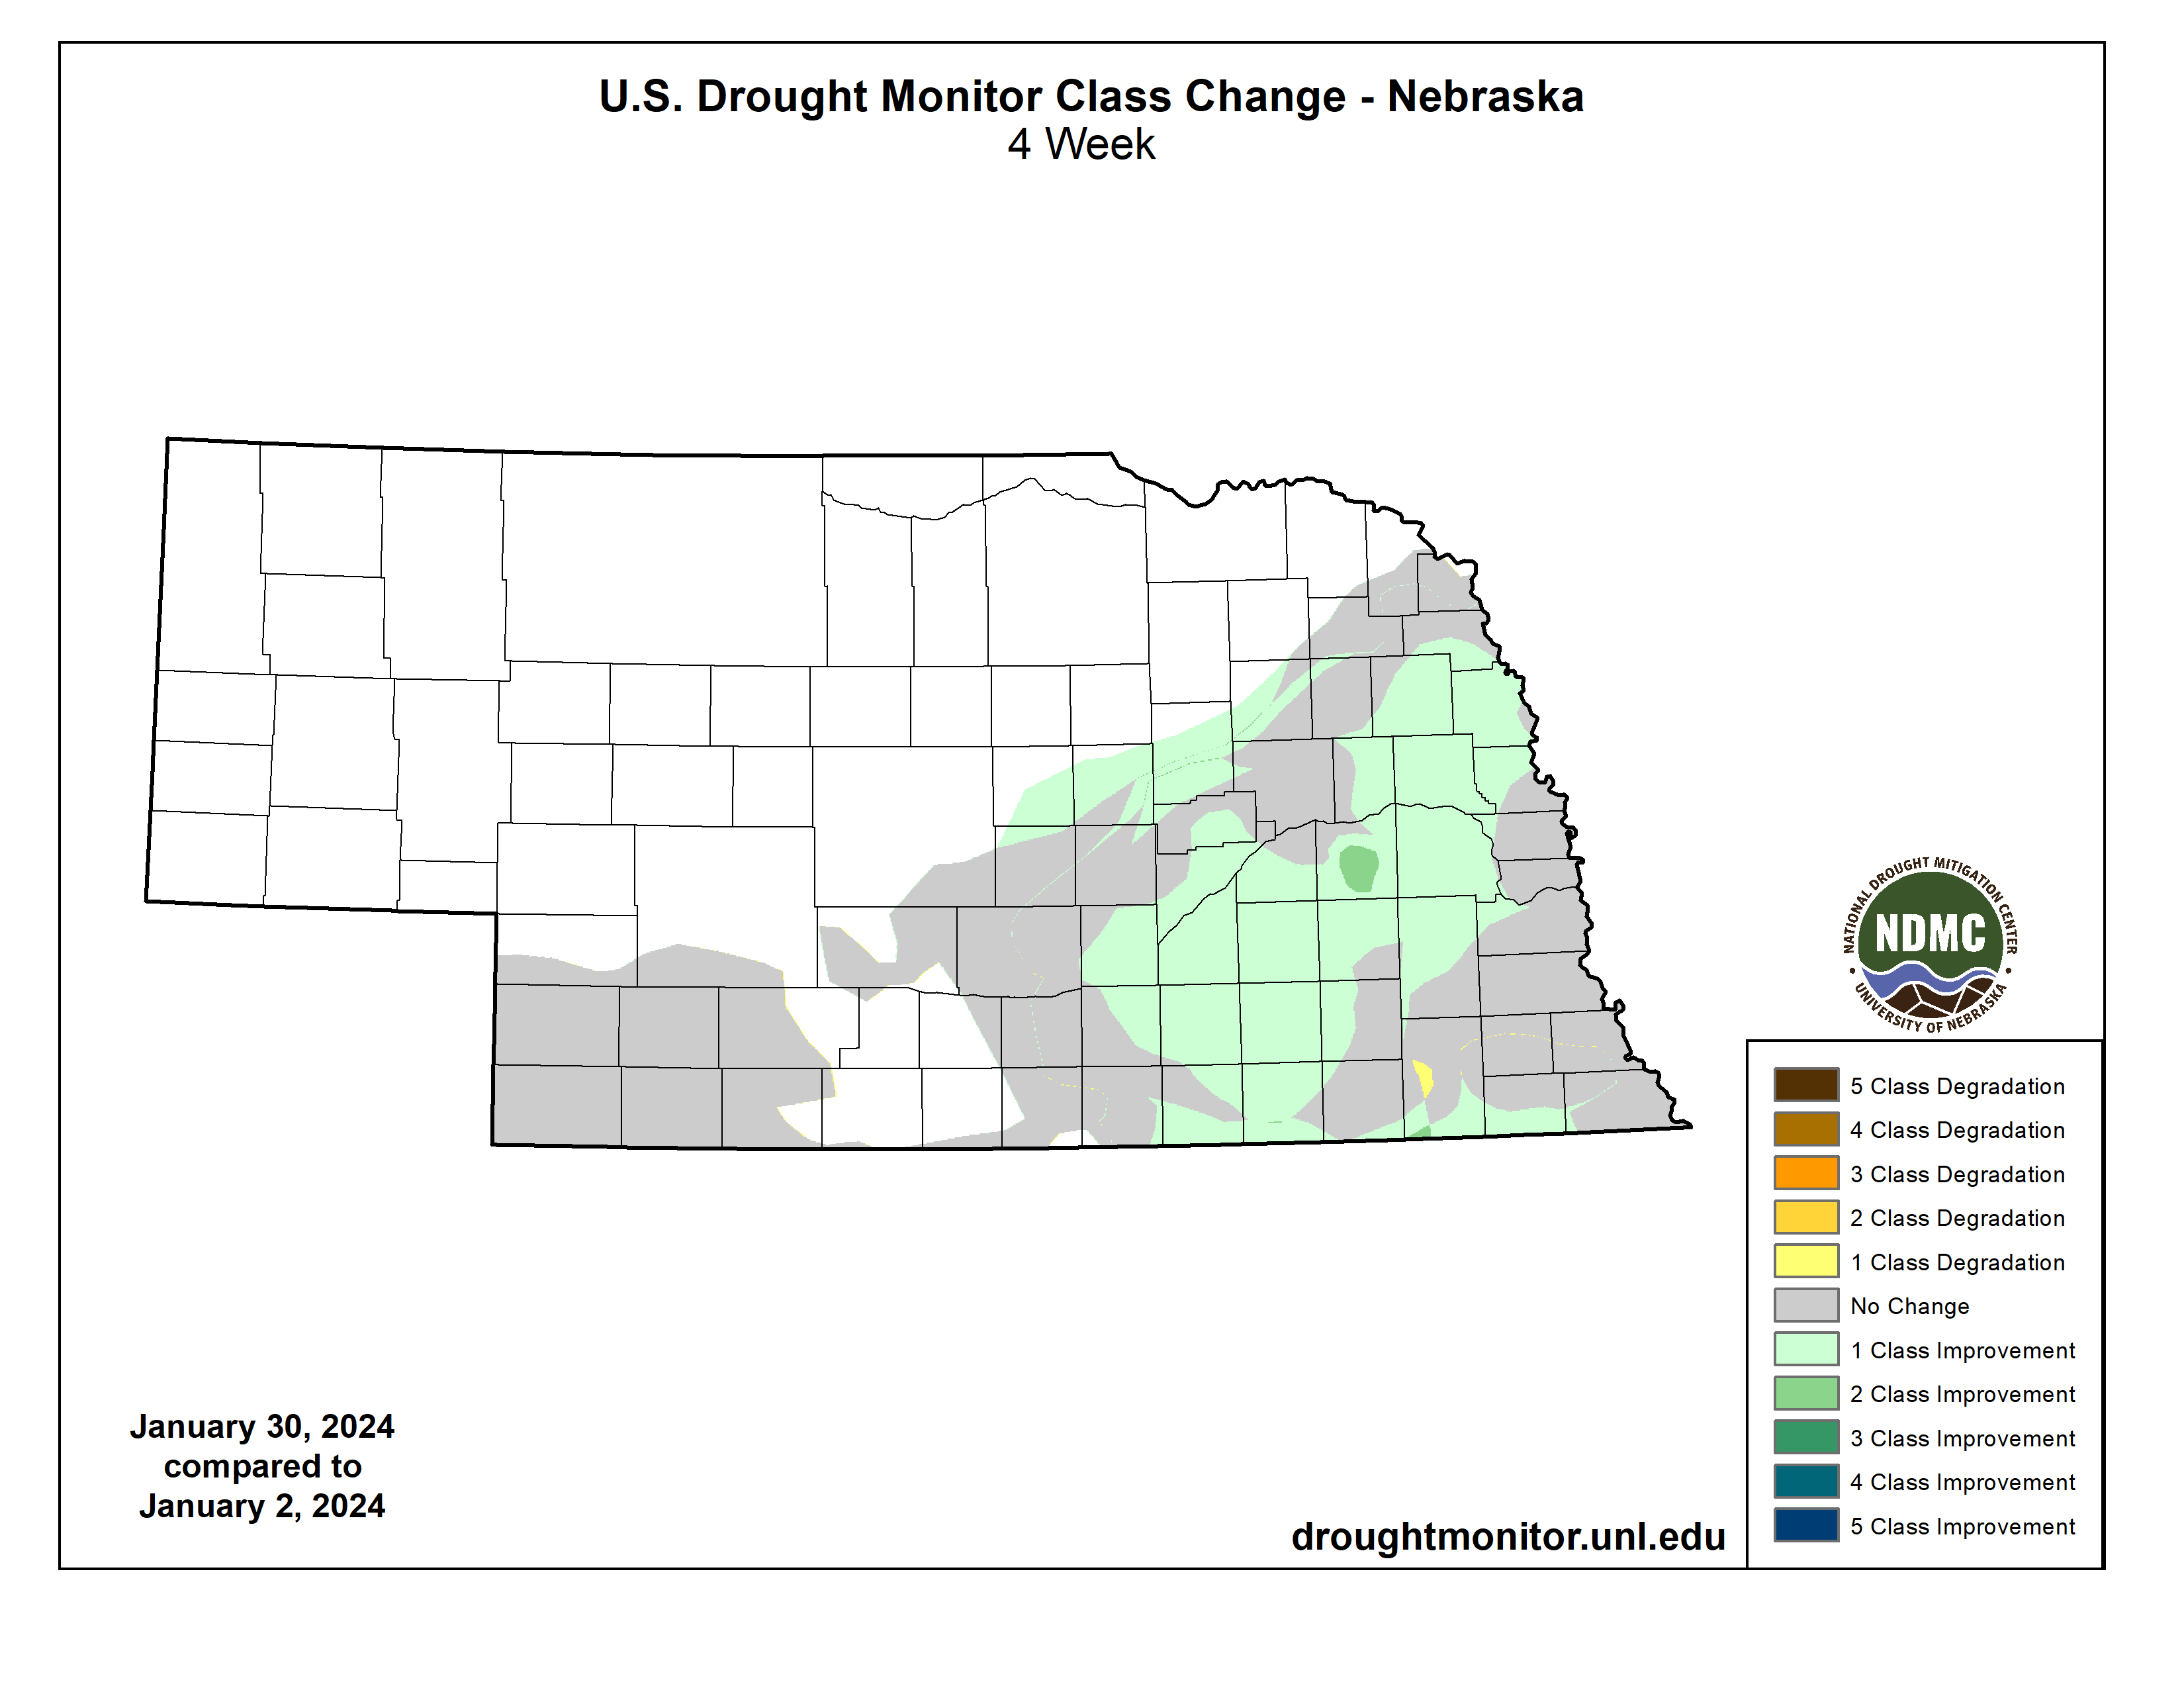
Drought Improvement
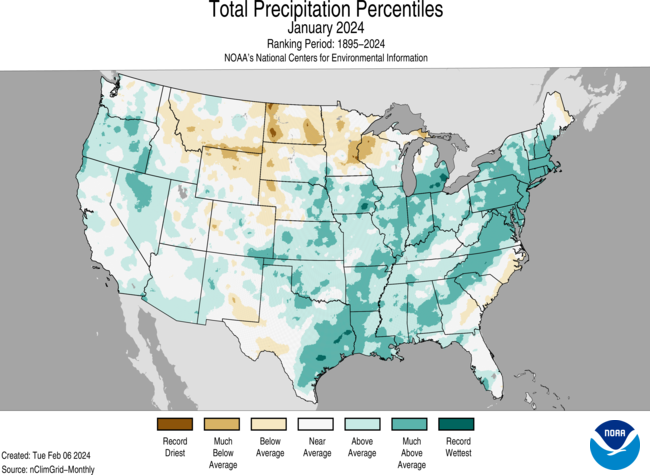
Total precipitation in the state for January was 0.66", which is 0.16" above average. This was the fourth January in the last five years with precipitation above the 20th century average. With above average precipitation for much of the state, there was some meaningful drought improvement. Indeed, 1-category improvements were noted over much of the eastern third of the state and only one pocket of Gage County saw any degradation.
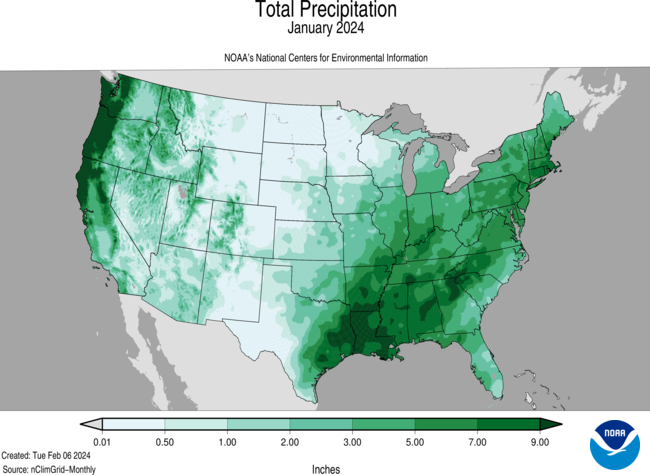
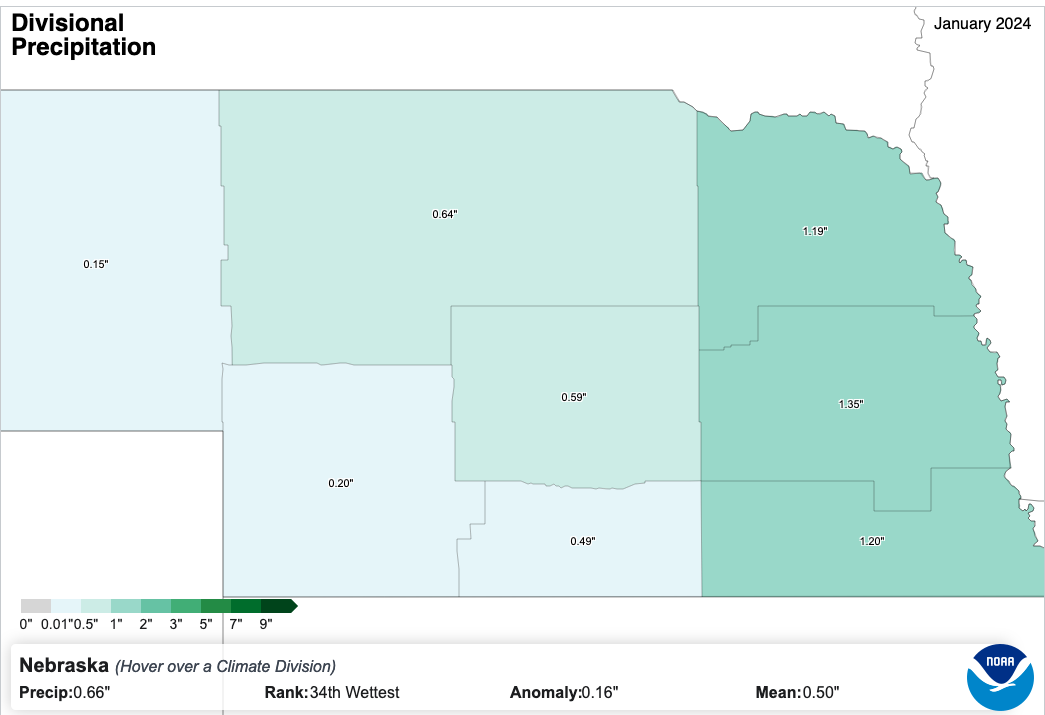
Precipitation Summary by Crop Reporting District
Panhandle 0.15" (-0.25")
North Central 0.64" (+0.17")
Northeast 1.19" (+0.58")
Central 0.59" (+0.11")
East Central 1.35" (+0.70")
Southwest 0.20" (-0.19")
South Central 0.49" (+0.03")
Southeast 1.20" (+0.53")
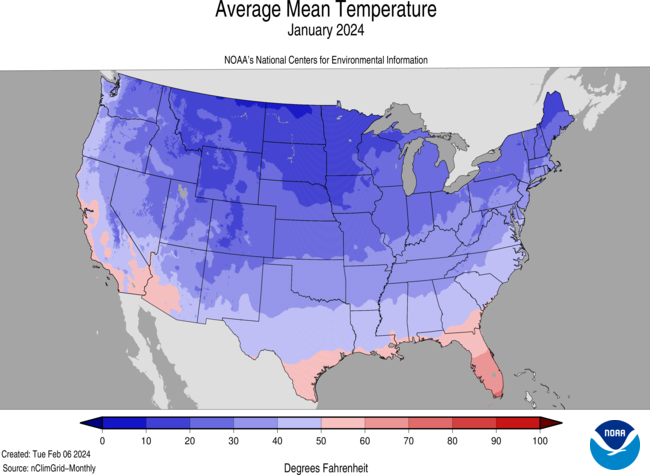
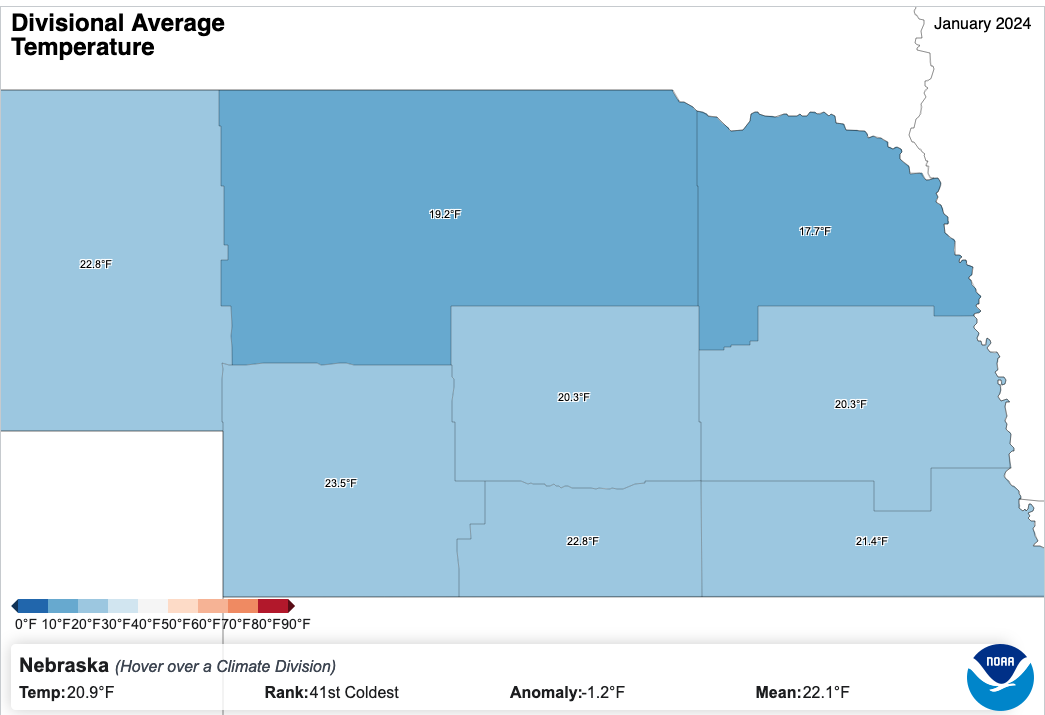
Temperature Summary by Crop Reporting District
Panhandle 22.8 F (-0.5 F)
North Central 19.2 F (-1.7 F)
Northeast 17.7 F (-1.0 F)
Central 20.3 F (-1.7 F)
East Central 20.3 F (-1.0 F)
Southwest 23.5 F (-1.3 F)
South Central 22.8 F (-1.2 F)
Southeast 21.4 F (-1.8 F)
Eric Hunt, University of Nebraska Extension