Another warm June, precipitation around average
June 2024 checked in with an average temperature of 71.3F and an average total precipitation of 3.84" respectively. Temperatures were 3.0F above the long-term average and precipitation was marginally above average. It was, however, the wettest June in six years. Temperatures were well-shy of record levels at the state level (record warmest was 76.6F in 1933). But June 2024 continued a decadal trend toward June being warmer, a trend which has been even more pronounced in recent years. Of the past ten years, only one (2019) was below the long-term average of 68.3F. Nationally it was the second warmest June on record and it was the warmest June on record globally. It was the 13th consecutive month with record global temperatures.
Floods and Drought
Precipitation was right around average statewide but that is definitely not the whole story. Some areas in east central and north central Nebraska picked up excessive rainfall at times, particularly during the week of June 16-22 when stalled out boundaries were a focal point for training thunderstorms. Areas most affected were between Dannebrog and Columbus on the 21st and up around O'Neill the day before. Rainfall in June did bring drought relief to parts of eastern Nebraska, though some of the relief depicted on the change map dated July 2nd did fall on July 1st into the early morning hours of July 2nd. Nevertheless, over the past year much of eastern NE saw between 3 and 5 categories worth of drought improvement.
Where things did not improve was in parts of the Panhandle and the southwestern corner of Nebraska. The dryness of late spring in the western Panhandle carried into June and a large section of Scotts Bluff and Sioux counties (as well as sections of Dawes and Box Butte counties) saw 2-category degradation on the U.S. Drought Monitor into moderate drought. Portions of southwestern Nebraska between Imperial and North Platte technically didn't go into drought but did see abnormally dryness come in during the month of June. Heat toward the end of the month in this area also factored into the degradation.
Extremes and Tabular Summaries
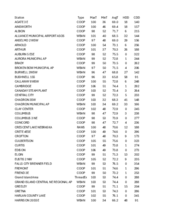
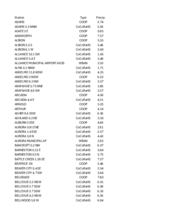
Attached are .pdf's containing Nebraska Mesonet station summaries, temperature/HDD/CDD, and precipitation summaries for stations around the state. Includes CoCoRaHS observer reports in the precipitation summary. Below are the temperature and precipitation extremes around the state in June.
Maximum Daily High Temperature: 106F, Superior
Minimum Daily High Temperature: 61F, Kilgore
Minimum Daily Low Temperature: 32F, Chadron 3SW
Maximum Daily Low Temperature: 79F, Auburn 5ESE
Max Monthly Precipitation: 10.77", Central City 6.8 NNE
Eric Hunt, University of Nebraska Extension


