
Highlights
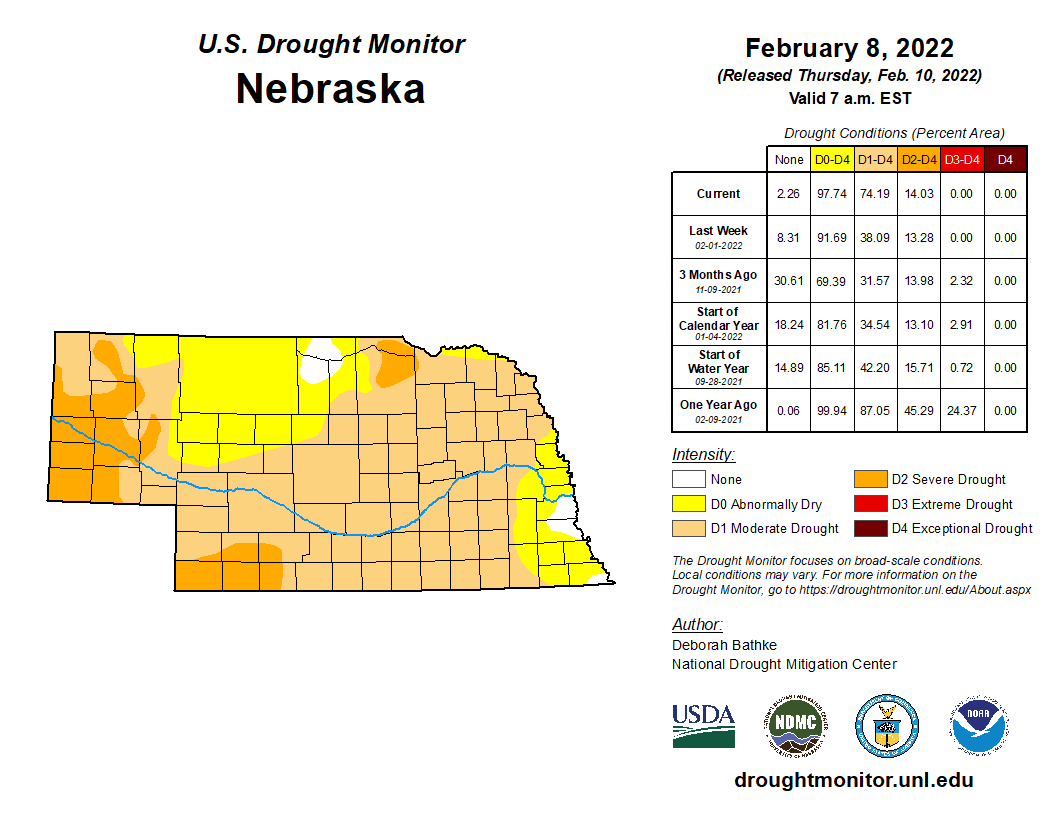
Persistent dryness and a dismal snow season to date highlight this mid-winter month. Long-term dryness for the northeast, west and southwest have remained in place for the past year and a half and a stubbornly dry winter has resulted in dryness and drought expansion in the central and east. The state was sitting at 23% abnormally dry, 60% moderate drought (D1) and 14% severe drought (D2) by February 8th. The seasonal climate outlook is currently predicting drought persistence through the spring. Higher daytime high temperatures and lower nighttime lows were the general rule during January. We experienced a statewide high temperature of 68°F, low of -20°F and wind chill temperature of -38°F. Over the past three months (November through January), the statewide average temperature for Nebraska ranks as 5th warmest while our total precipitation is 7th driest on record.
Precipitation and Drought
Snowfall during January was most abundant in the southern Panhandle and southwest. Bridgeport, Bushnell, Harrisburg (the highest at 16.8 inches), Imperial and Sidney all reported totals of more than 10 inches. Other locations in the southwest received more than six inches. Some areas of the far southeast also reported more than five inches, Tecumseh coming in at 9 inches. Elsewhere around Nebraska, January snow totals were a few inches or less. The season-to-date snowfall totals are less than desirable for much of the state. A sampling from west to east are as follows: Scottsbluff (18.4 inches), Chadron (16.9), Ogalalla (12.8), Imperial (13.8), Valentine (13.2), Kearney (5.6), Norfolk (3.7), Columbus (2.0), Lincoln (3.7), Fairbury (4.0), Omaha (7.8), Falls City (8.0).
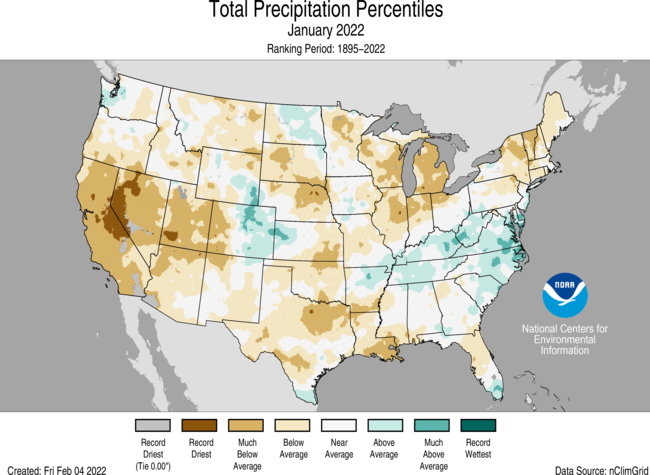
Precipitation for the month was below average for the northern Panhandle and eastern two-thirds of Nebraska (less than 50% of normal). The southwest and southern Panhandle saw slightly above normal precipitation. The statewide average total this month was 0.21 inch, which ranks as 18th driest on record. When looking at changes over time, January precipitation trends for Nebraska are not particularly strong. It is also a time of year when precipitation totals are fairly light. The last century as well as the past several decades do not show a discernible trend toward wetter or drier for our state average January precipitation total.
Drought worsened for portions of the east and by the first week of February only 2% of Nebraska had no abnormal dryness or drought, according to the U.S. Drought Monitor. Severe drought covers 14% of the state, occurring in the northeast, Panhandle and southwest. This represents longer-term issues that have remained in drought for the past 18 months or so. About half of Nebraska was abnormally dry at the start of February and a large swath was added in eastern sections of the state due in January to ongoing dryness for this winter season. As of the February 8th release of the Drought Monitor, 60% of the state is now in drought conditions.
Temperature
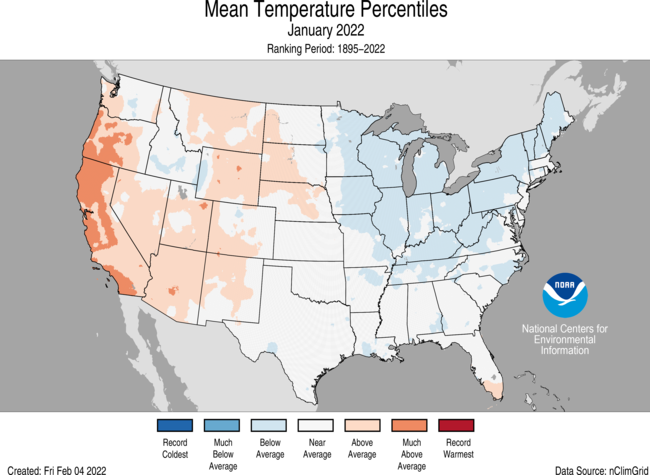
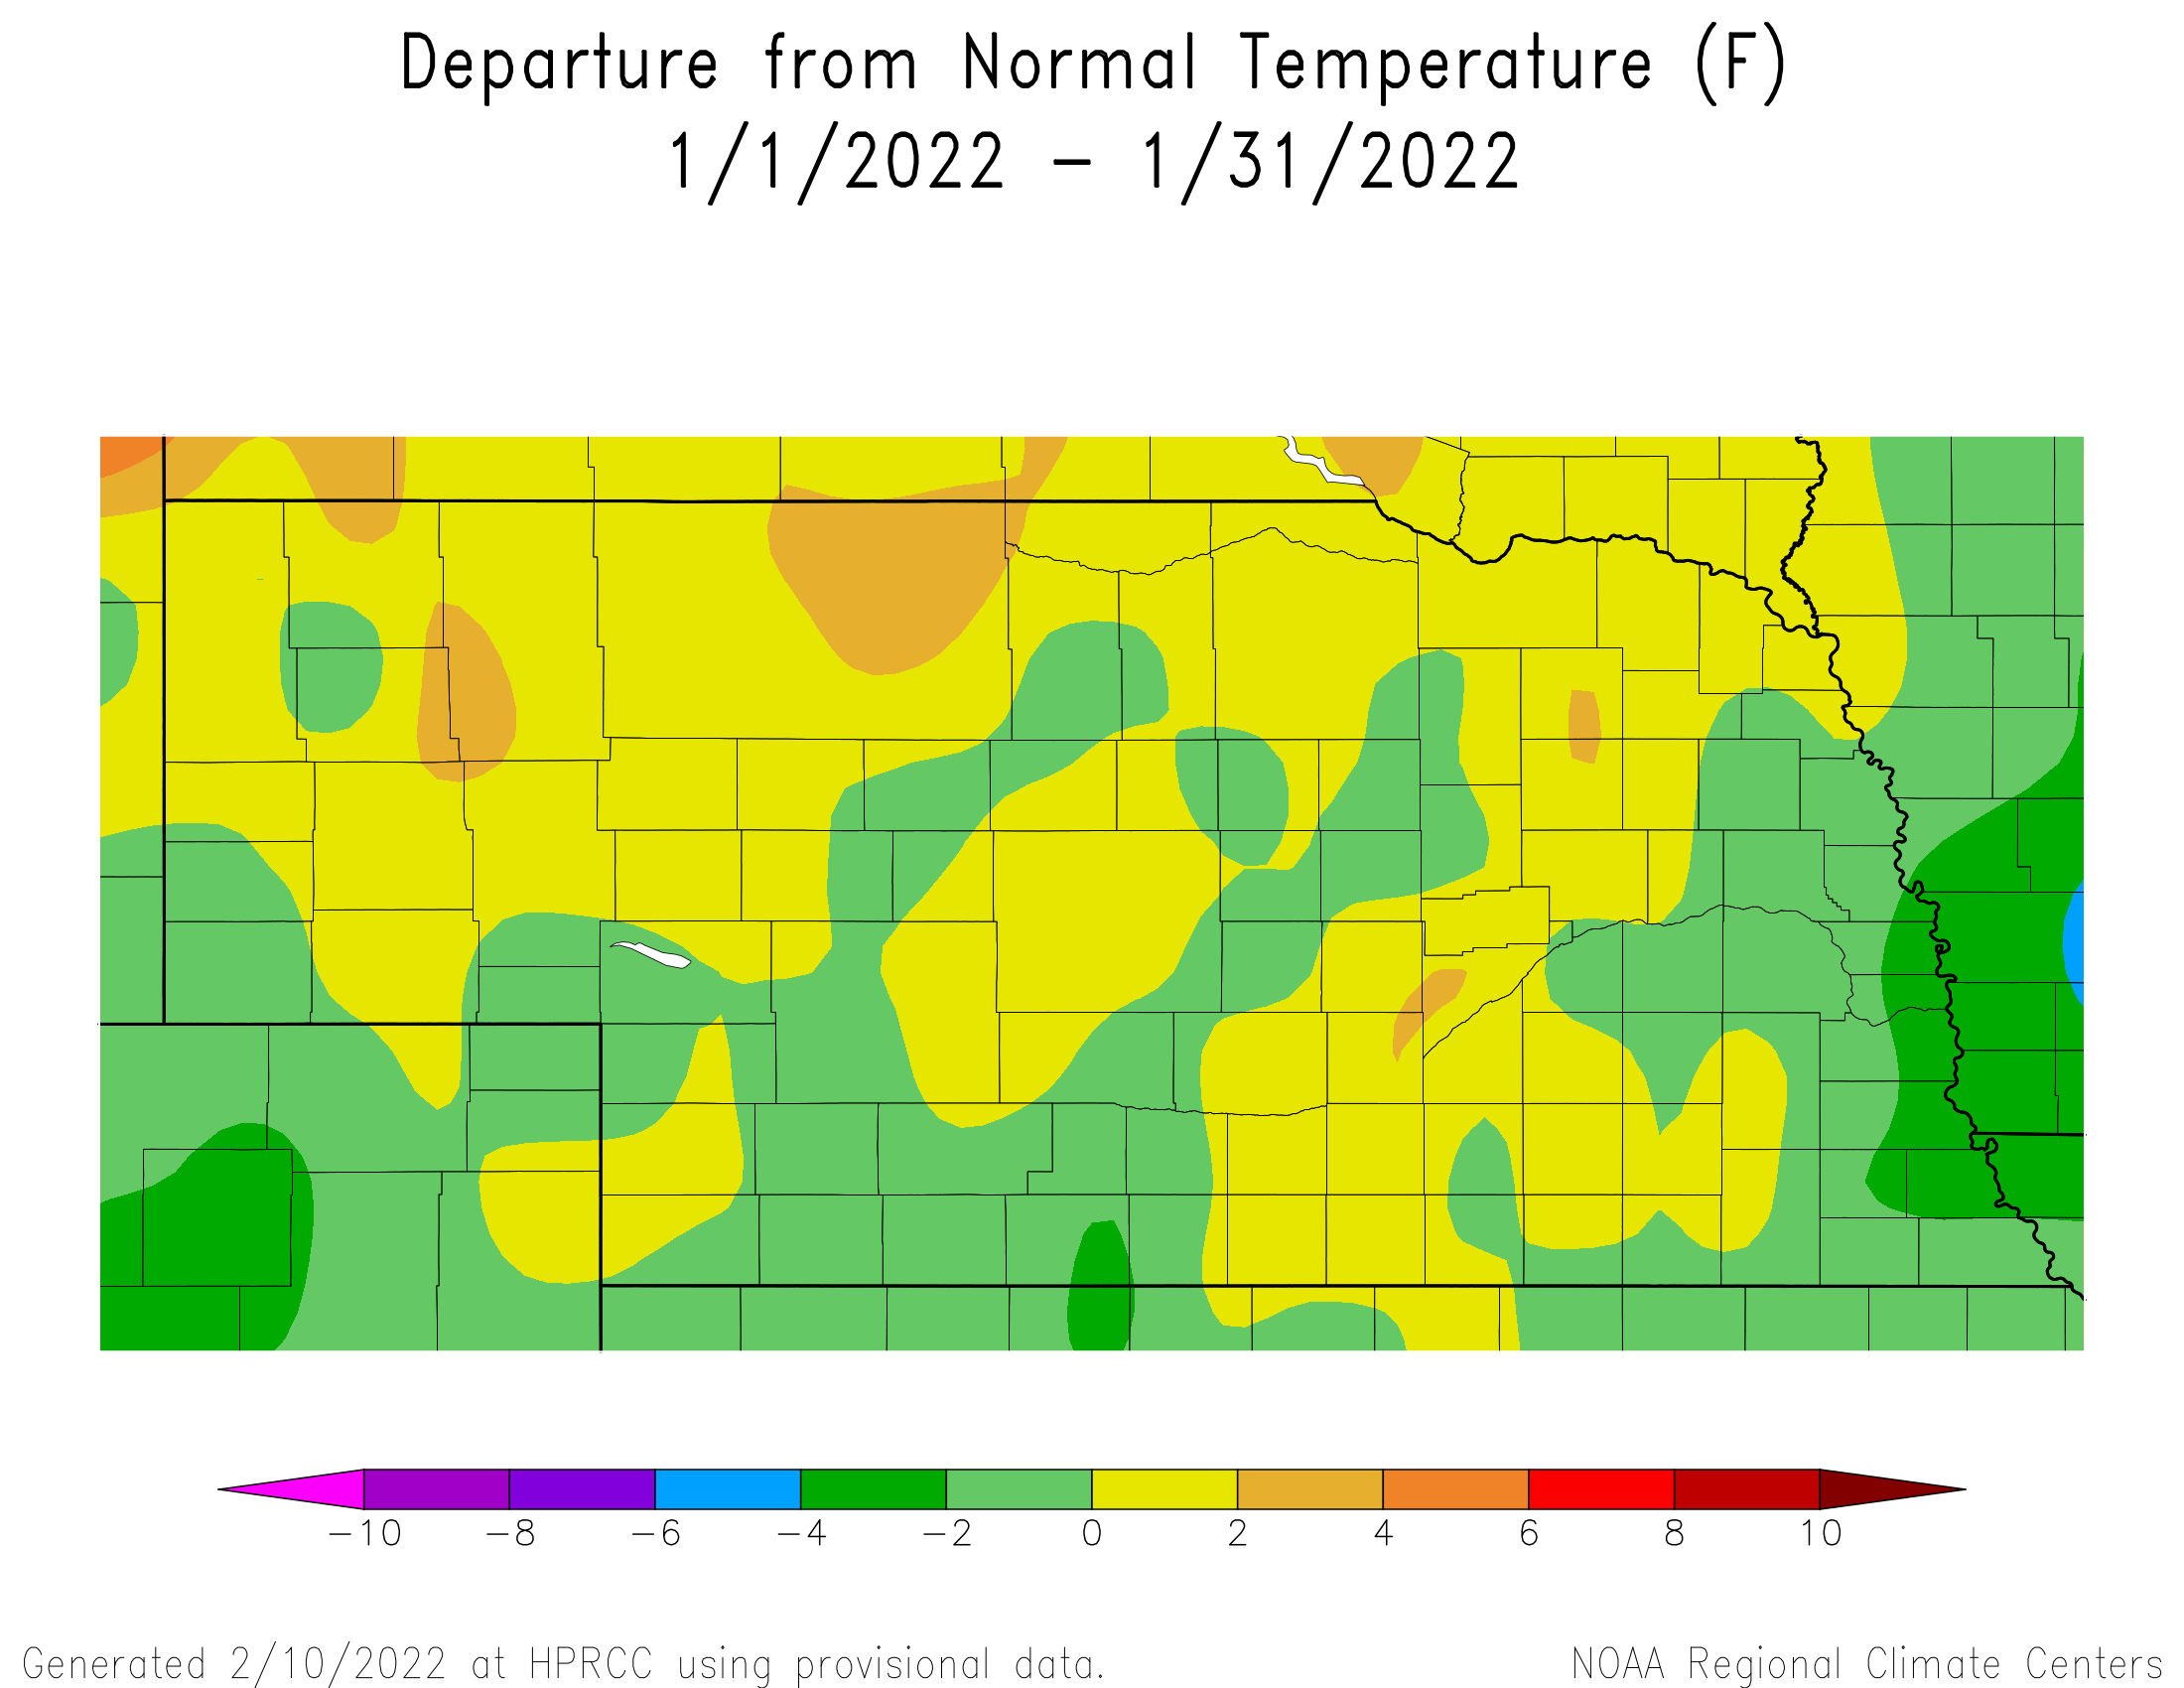
This January, high temperatures averaged above normal for much of the state while low temperatures were generally below normal. The statewide high temperature of 68°F occurred near Lincoln and it got as warm as the 50s and 60s around Nebraska. Reporting stations across the state observed below zero temperatures with -20°F being the lowest January temperature this year, occurring near Wallace and North Platte. Monthly average temperatures were above normal for portions of the east and north while below normal temperatures dominated the southern flank, central and east. Nebraska has experienced a general warming of our January temperatures, both in recent decades as well as over the past century. This year the statewide average of 25.6°F is half a degree warmer than normal.
Impacts
January precipitation was below normal across the state, except for the western half of the Panhandle from Scottsbluff to the Colorado border and the southwest corner of the state. The vast majority of moisture received across these areas was associated with a cold air masses diving southward from the northern Plains and creating orographic lift on January 6th and 21st. Further east, precipitation was considerably light due to very dry surface conditions inhibiting precipitation from making to the surface before evaporating into the atmosphere. The lack of snow cover and periodic blasts of Arctic air lasting 2-4 days in length resulted in frost depths ranging from 8 to 20 inches under grass by the end of the third full week of January. Brief warming the final 10 days of the month pulled most of the frost out of the ground south of I-80 and reduced frost depths to 4 to 16 inches north of I-80 by January 31st.
The lack of moisture this entire winter coupled with above normal temperatures during November and December have led to declines for lakes, ponds and rivers. These declines were limited somewhat during this past month due to the formation of ice cover. Until significant precipitation events develop, further deterioration is likely given that recent warmth begun to erode ice cover across the western two-thirds of Nebraska. The lack of snow cover has likely led to moisture stress for the winter wheat crop across the western third of the state, but winterkill reports have been minimal due to the brunt of Arctic air remaining east of the region for most of January. The dry conditions during January did have some positive benefits including open grazing of corn stalk without significant supplemental feed, the lack of widespread health issues for feedlot operations. However, with dryness extending well over 18 months across western Nebraska, there has been an uptick in hay moving west which likely reflects low hay stocks from this past growing season.
Outlook
The Climate Prediction Center (CPC) released their updated February temperature and precipitation outlooks on January 31st which indicates a slight chance for below normal temperature across extreme northeastern Nebraska. Otherwise, CPC indicates that there are equal chances for above normal, normal, or below normal temperatures and precipitation for the remainder of the state. Due to the persistent dryness that has been firmly established across the state since the beginning of November, CPC’s precipitation outlook doesn’t offer any short-term signal that would indicate a strong bias away from the persistent upper air trough that has been in place over the Great Lakes region since the beginning of January. Current numerical models indicate that this four-week pattern will dominate through the middle of February before any significant upper air trough development occurs across the western United States.
On a national basis, CPC indicates that above normal moisture is favored for Montana, North Dakota, the northern half of Minnesota, as well as the Great Lakes region southwestward to northeast Texas and northern Louisiana. Below normal moisture is favored for California, Nevada, Utah, Arizona, New Mexico and the southwestern half of Colorado. Below normal temperatures are forecast for the Pacific Northwest, most of North Dakota, the northeastern half of South Dakota, Minnesota, northwest Iowa, northern Wisconsin and the western half of the upper peninsula of Michigan. Above normal temperatures are expected for the southwestern United States, extreme southern and eastern Texas, as well as areas east of a line from northwest Louisiana to the thumb area of lower Michigan.
January Mesonet Extremes:
Highest air temperature: 66°F, 18th, Harvard 4SWLowest air temperature: -18°F, 2nd, Ord 2N
Lowest wind chill temperature: -38°F, 6th, Fordyce 4N
Max wind gust (9ft): 64 mph, 4th, Enders 10SW
Lowest 4inch soil temperature: 8°F, 6th, Ord 2N
Source: The Nebraska Mesonet at Nebraska State Climate Office