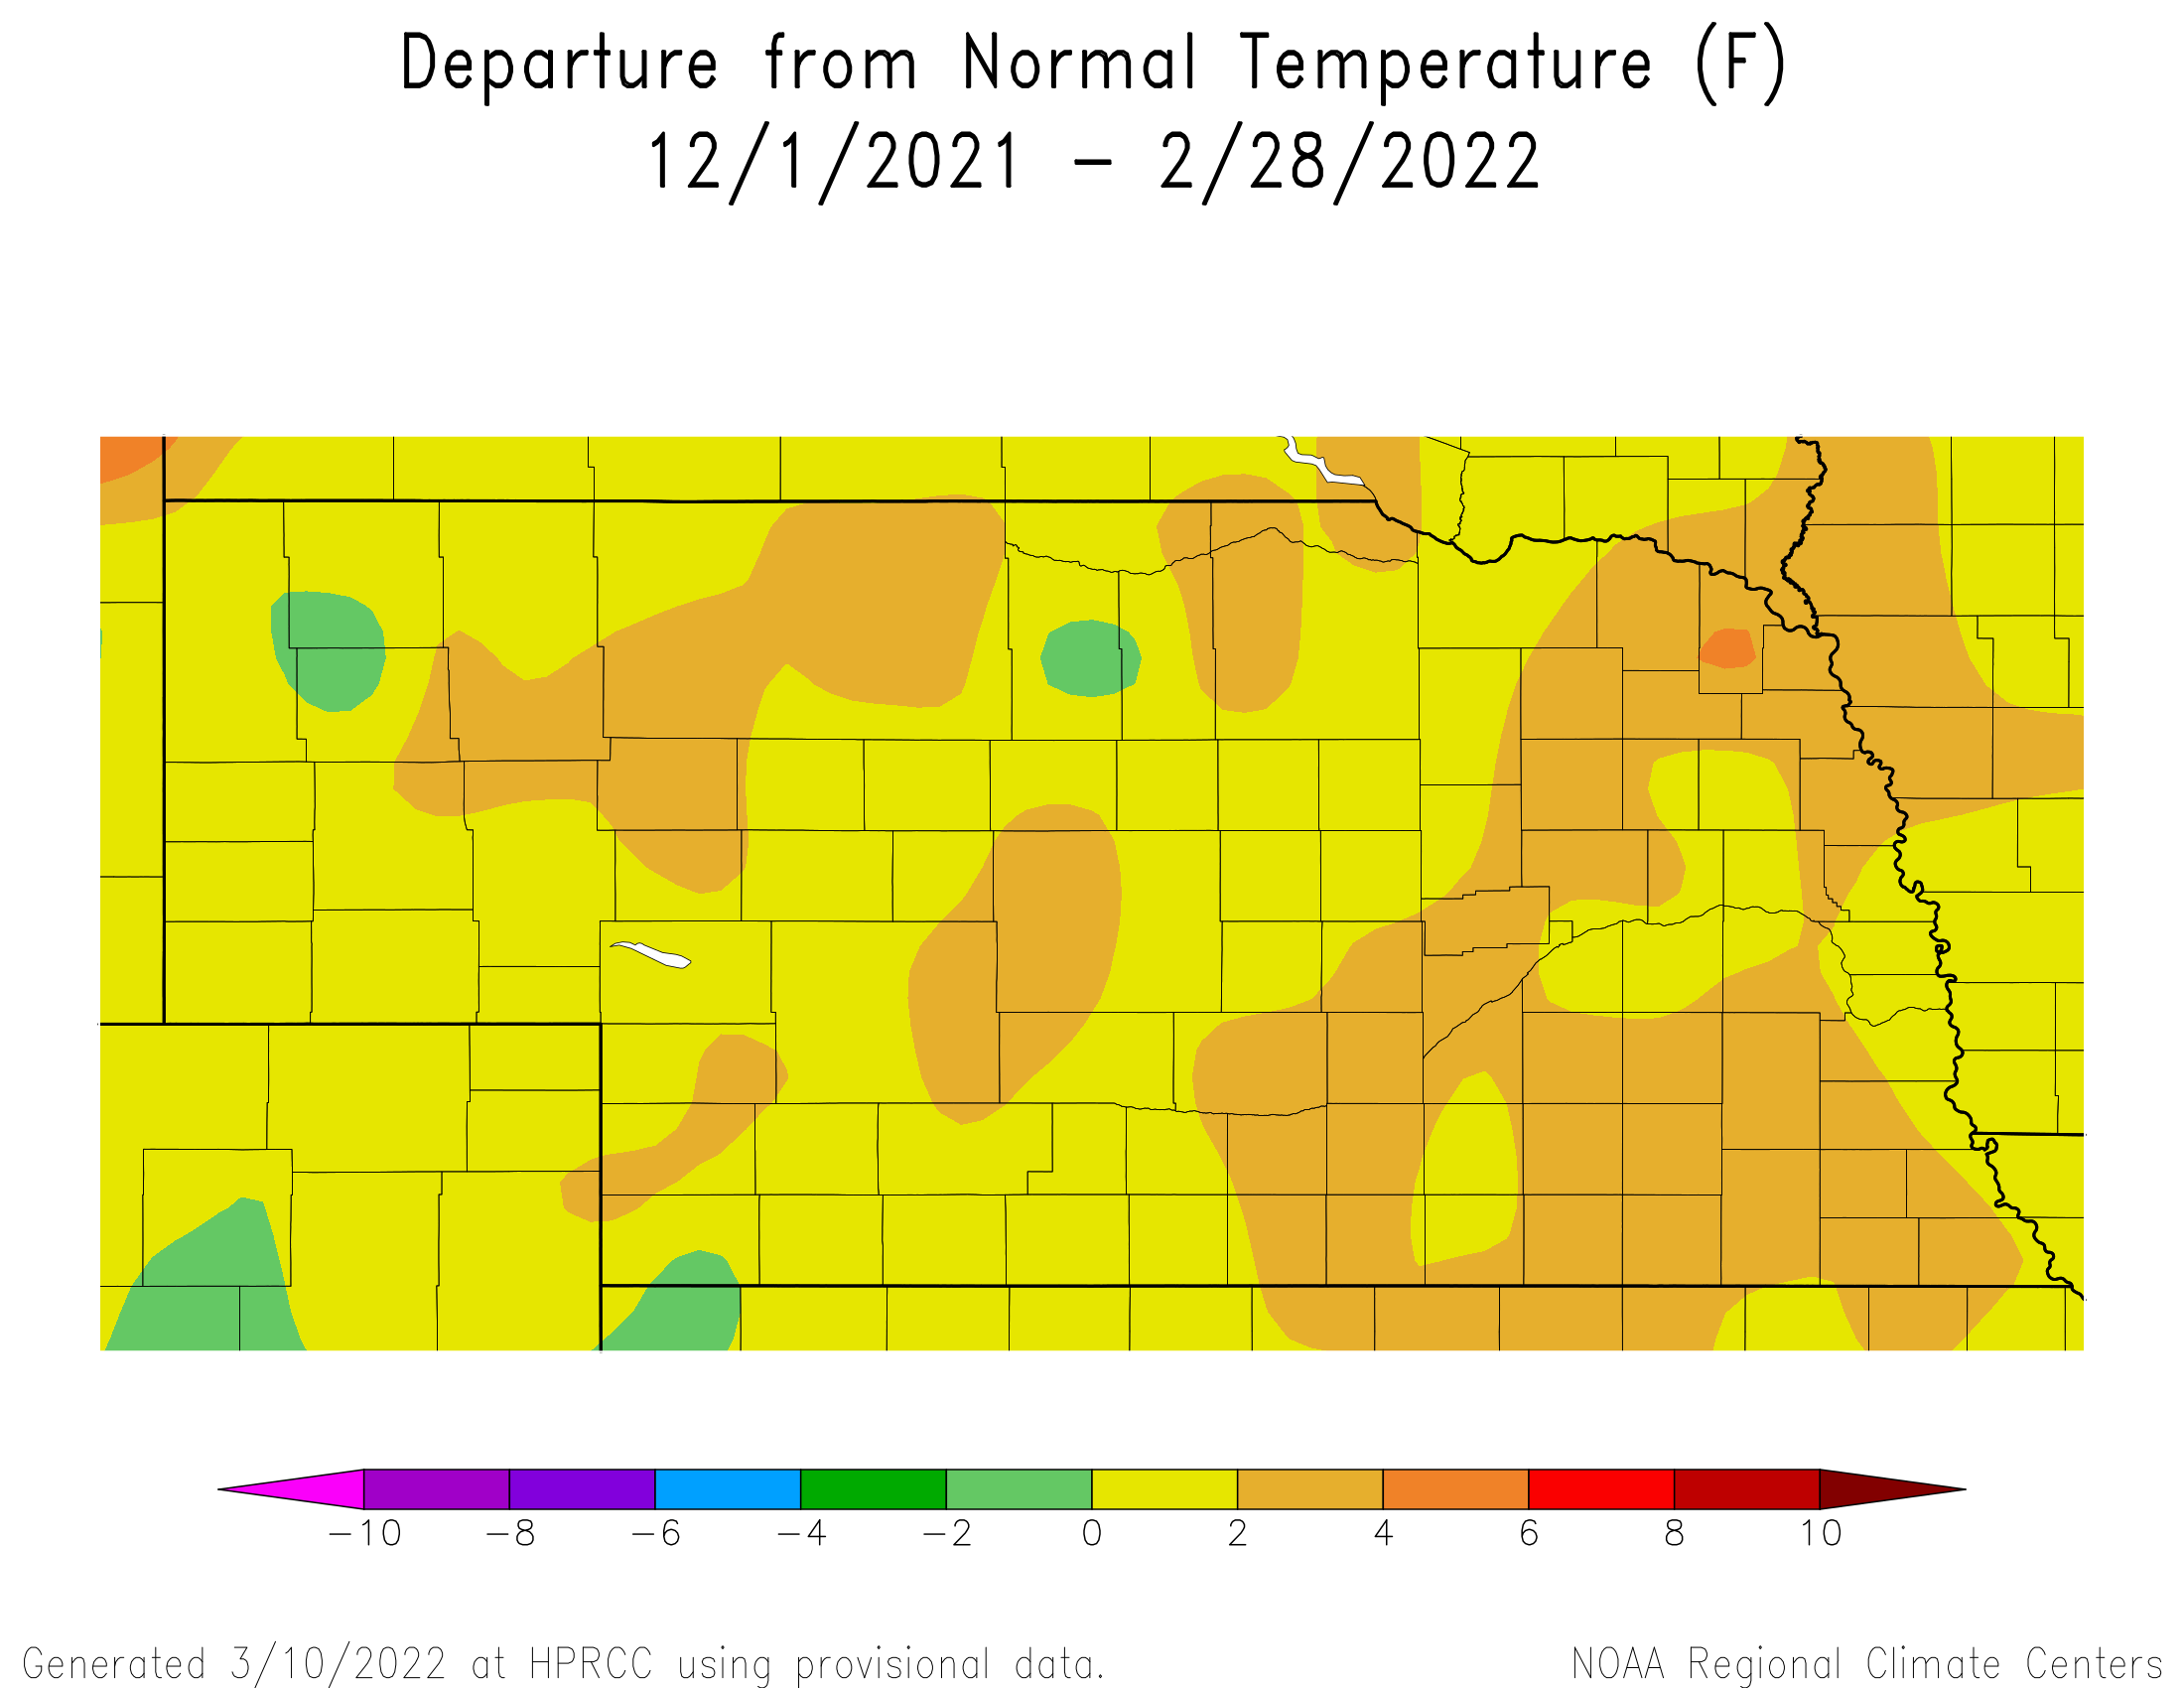
The National Center for Environmental Information (NCEI) has issued their preliminary temperature and precipitation rankings for this past winter season. The “preliminary” state average temperature was calculated at 28.7 F, which ranks 18th warmest since 1896 (128 years of data). NCEI indicates that Nebraska’s winter precipitation averaged across the state was 0.65 inches of water equivalent moisture, which ranks 4th driest on record. Figure 1 shows this past winter’s average temperature departure from normal (based upon the 1991-2020 normal period). Figure 2 shows the accumulated precipitation this past winter and Figure 3 is a depiction of the accumulated precipitation anomalies for the same period using the 1991-2020 comparison period.
When NCEI calculates each of the 50 state rankings, it is based upon the cumulative area contributions from each climate district. Nebraska has 8 climate districts: Panhandle, Northwest, Northeast, Central, East Central, Southwest, South Central and Southeast. The two largest climate districts (Panhandle and North Central) represent approximately 40 percent of the surface area of Nebraska, so state numbers calculated by NCEI are heavily influenced by conditions across the northwestern 1/3 of the state.
Since temperature and precipitation trends in any given period of time are not uniform across the state, looking at regional patterns helps to identify where trends are the strongest. So even though a state ranking has been provided by NCEI for average temperatures and precipitation, climate division rankings can provide more context in regards to what parts of the state are experiencing trends that are either stronger or weaker than the official state ranking number provided by NCEI.
The climate division breakdown for average temperatures this past winter are listed first followed by its current ranking (in parenthesis) when compared against 128 years of data going back to 1896. A rank of 1 indicates warmest on record, while a value of 128 would be coldest on record: Panhandle – 28.7 F (23); North Central – 27.6 F (18), Northeast – 25.9 F (21); Central – 28.9 F (15); East Central - 28.8 F (18); Southwest – 30.7 F (18); South Central – 30.4 F (22); Southeast - 30.4 F (18).
Although the winter temperature rankings calculated for the climate divisions were in the top 20th percentile for warmth, precipitation rankings were even more dramatic. A summary of the average precipitation (liquid equivalent) that fell in each climate district follows with the official ranking in parenthesis (a rank of 1 signifies the driest on record , a value of 128 equates to coldest on record): Panhandle – 0.72 inches (16); North Central – 0.79 inches (9), Northeast – 0.84 inches (6); Central – 0.37 inches (2); East Central – 0.63 inches (2); Southwest – 0.49 inches (8); South Central – 0.37 inches (3); Southeast – 0.61 inches (2).
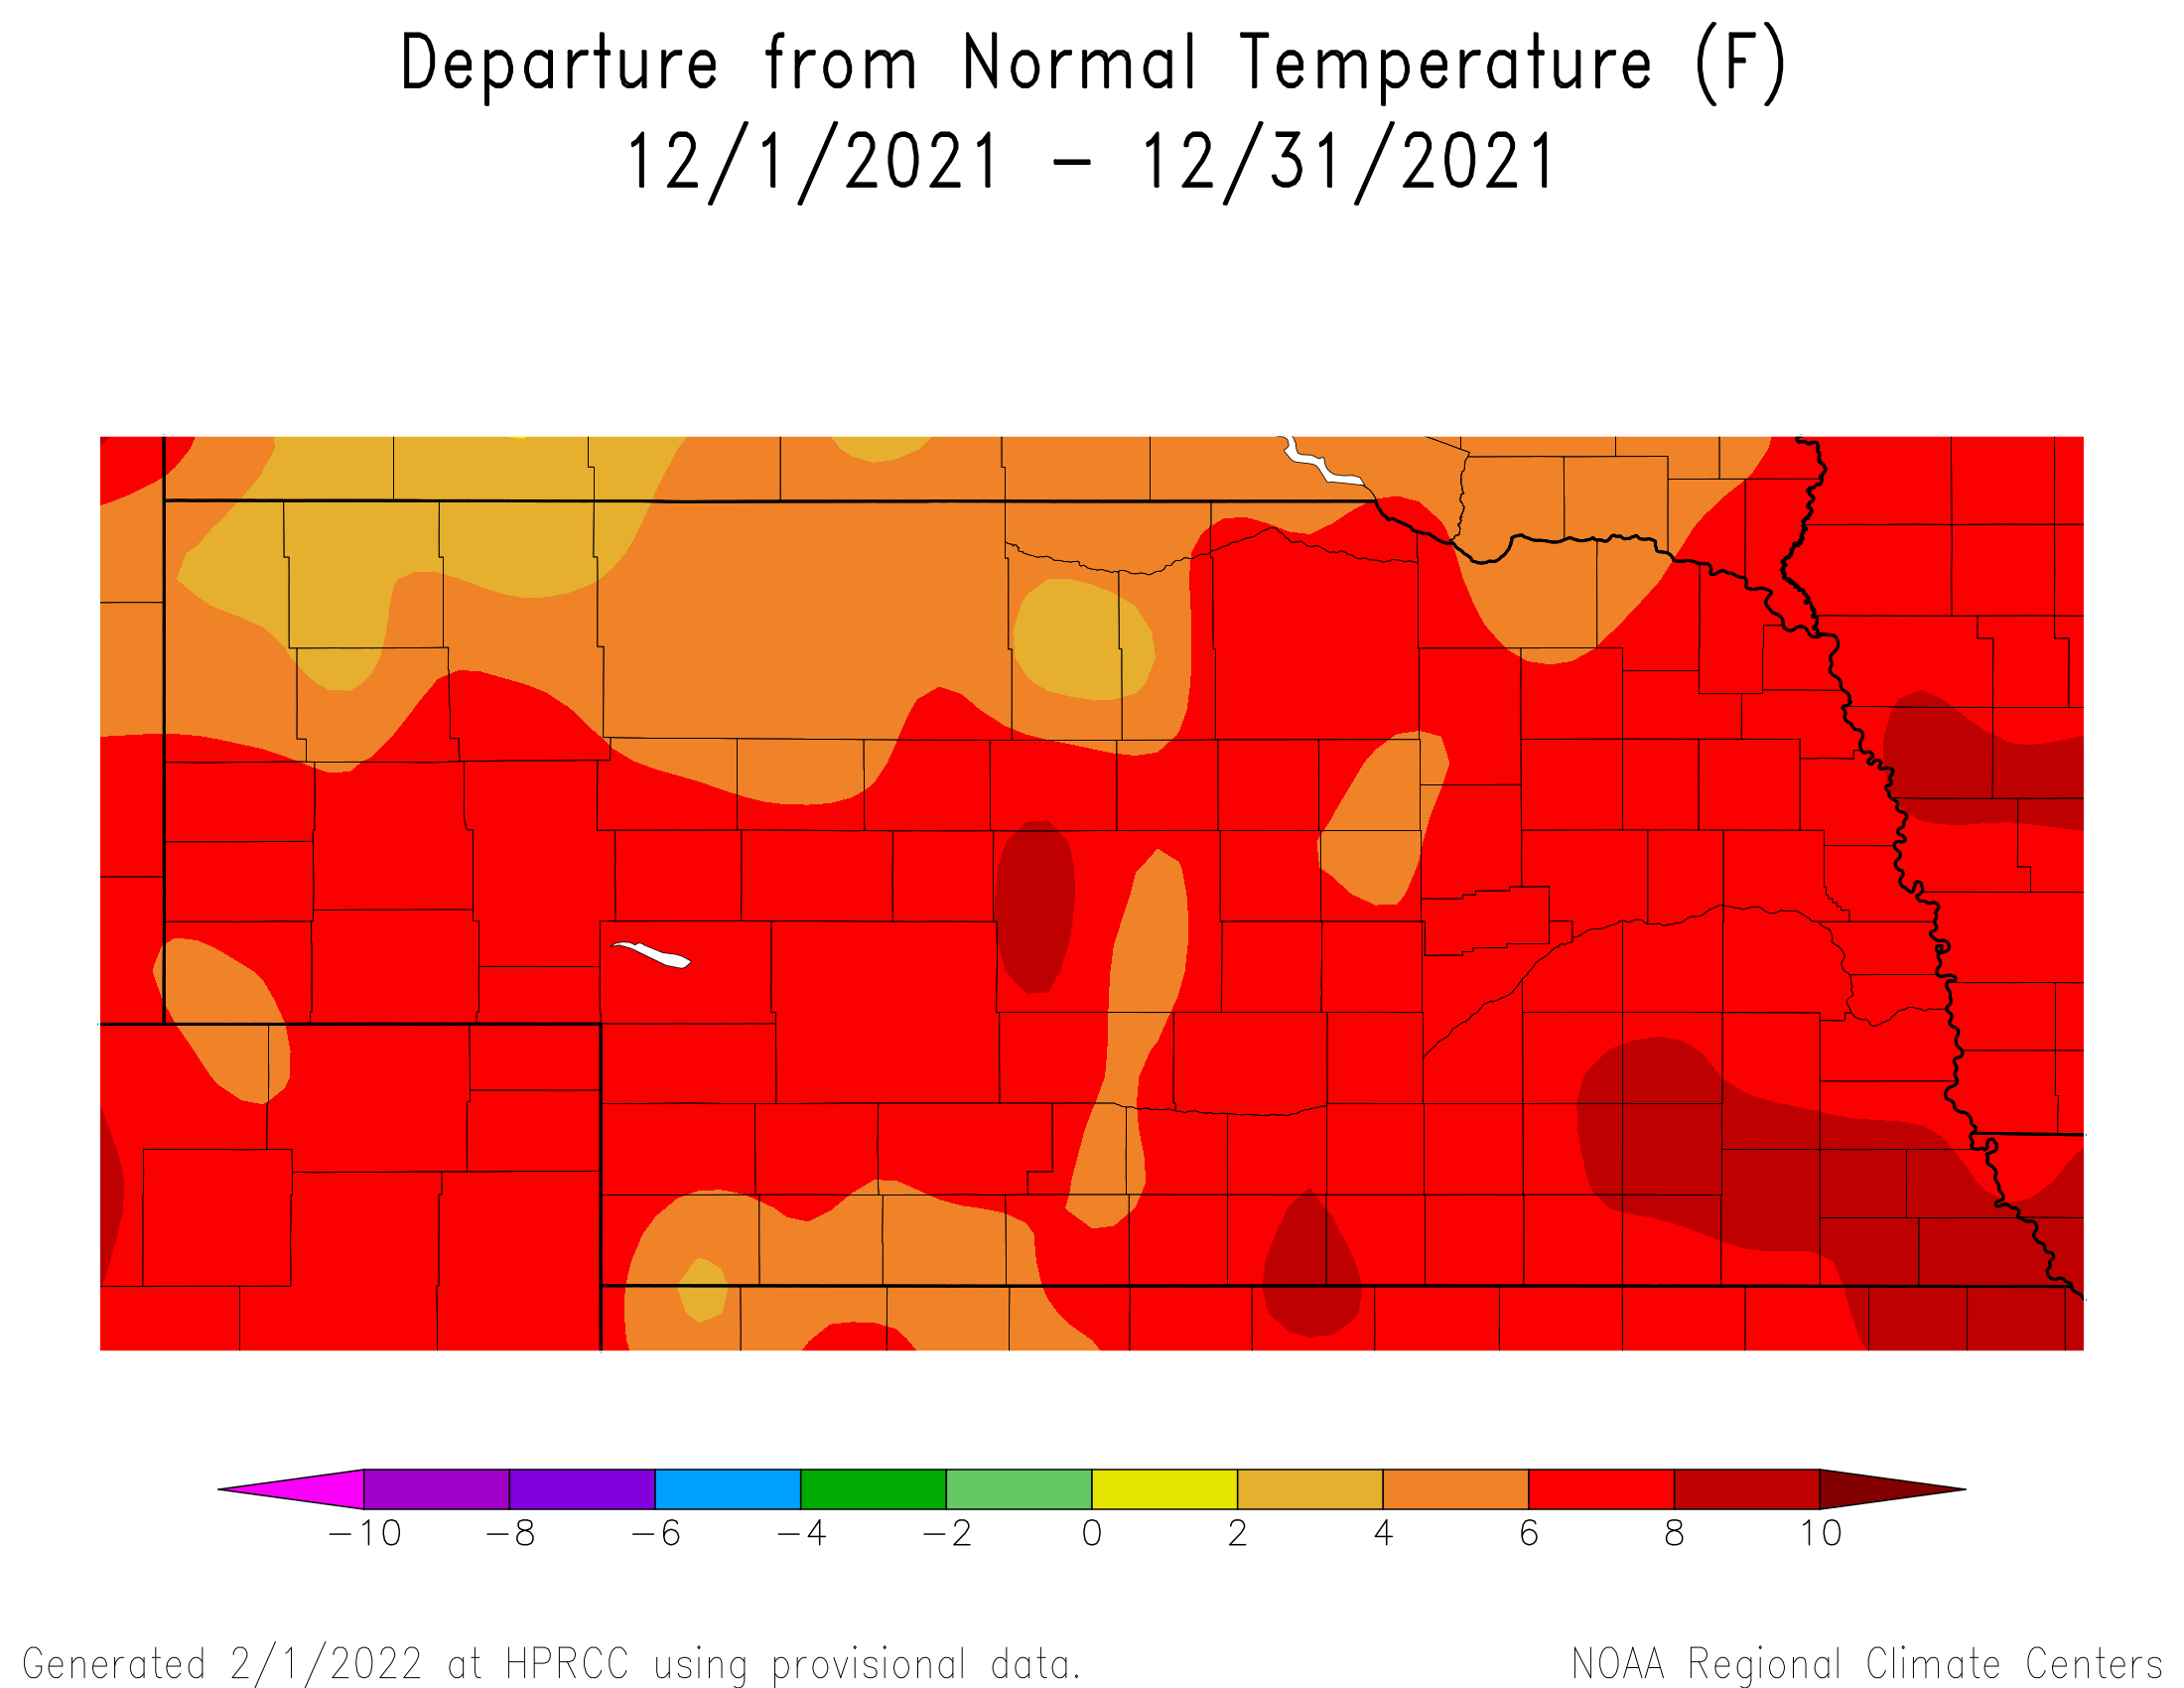
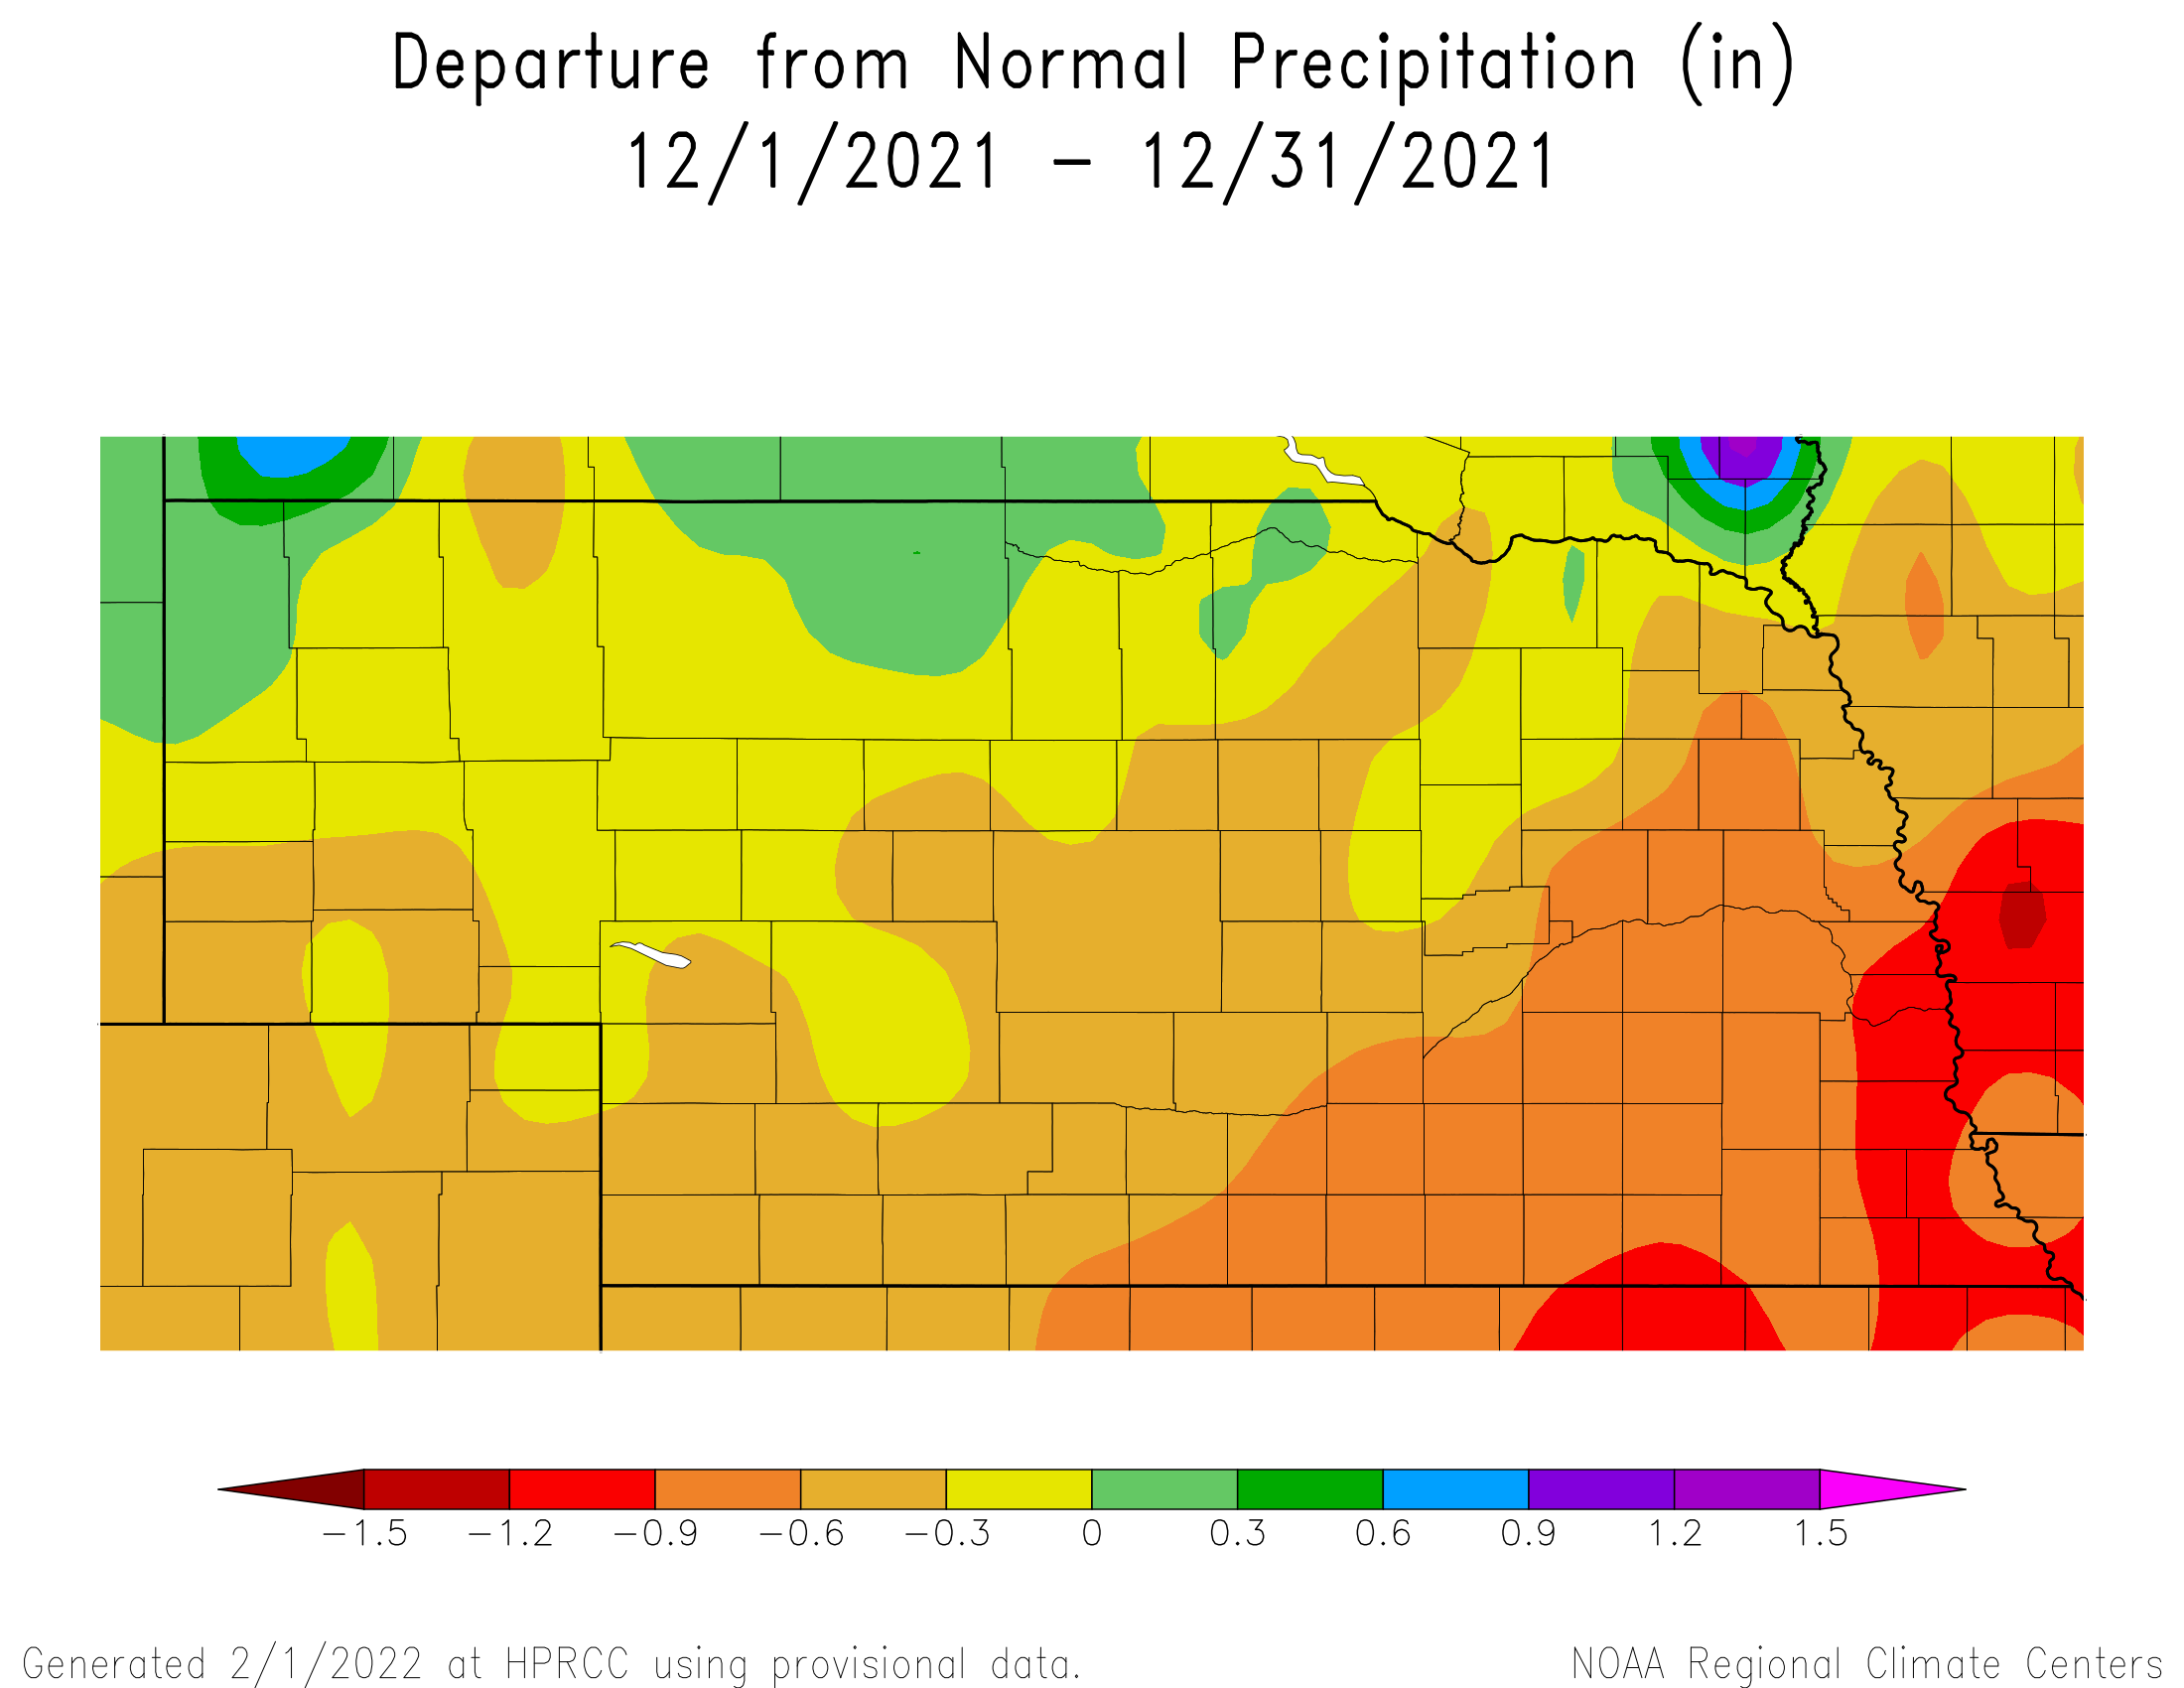
Winter temperature anomalies were heavily influenced by well above normal temperatures during December (Figure 4). Upper air ridging over the eastern half of the United States resulted in persistent southerly winds across the High Plains, while a mean upper air trough positioned over the western United States kept precipitation confined to the west of the Rocky Mountains and south of the northern High Plains (MT, ND, SD). Thus, surface lows that ejected out of this main troughing pattern had to overcome a very dry surface layer over the southern and central High Plains. The warm temperatures aloft resulted in weak precipitation events and below normal December moisture south of the northwestern Panhandle and the northern periphery of north central Nebraska (Figure 5).
The winter storm that traversed the United States New Year’s weekend ushered in a pattern change to the upper atmosphere favoring an upper air trough over the northern High Plains, upper Mississippi river valley and the western Great Lakes. This pattern dominated January and February, which left the western half of the Dakota’s and all of Nebraska west of the primary storm track.
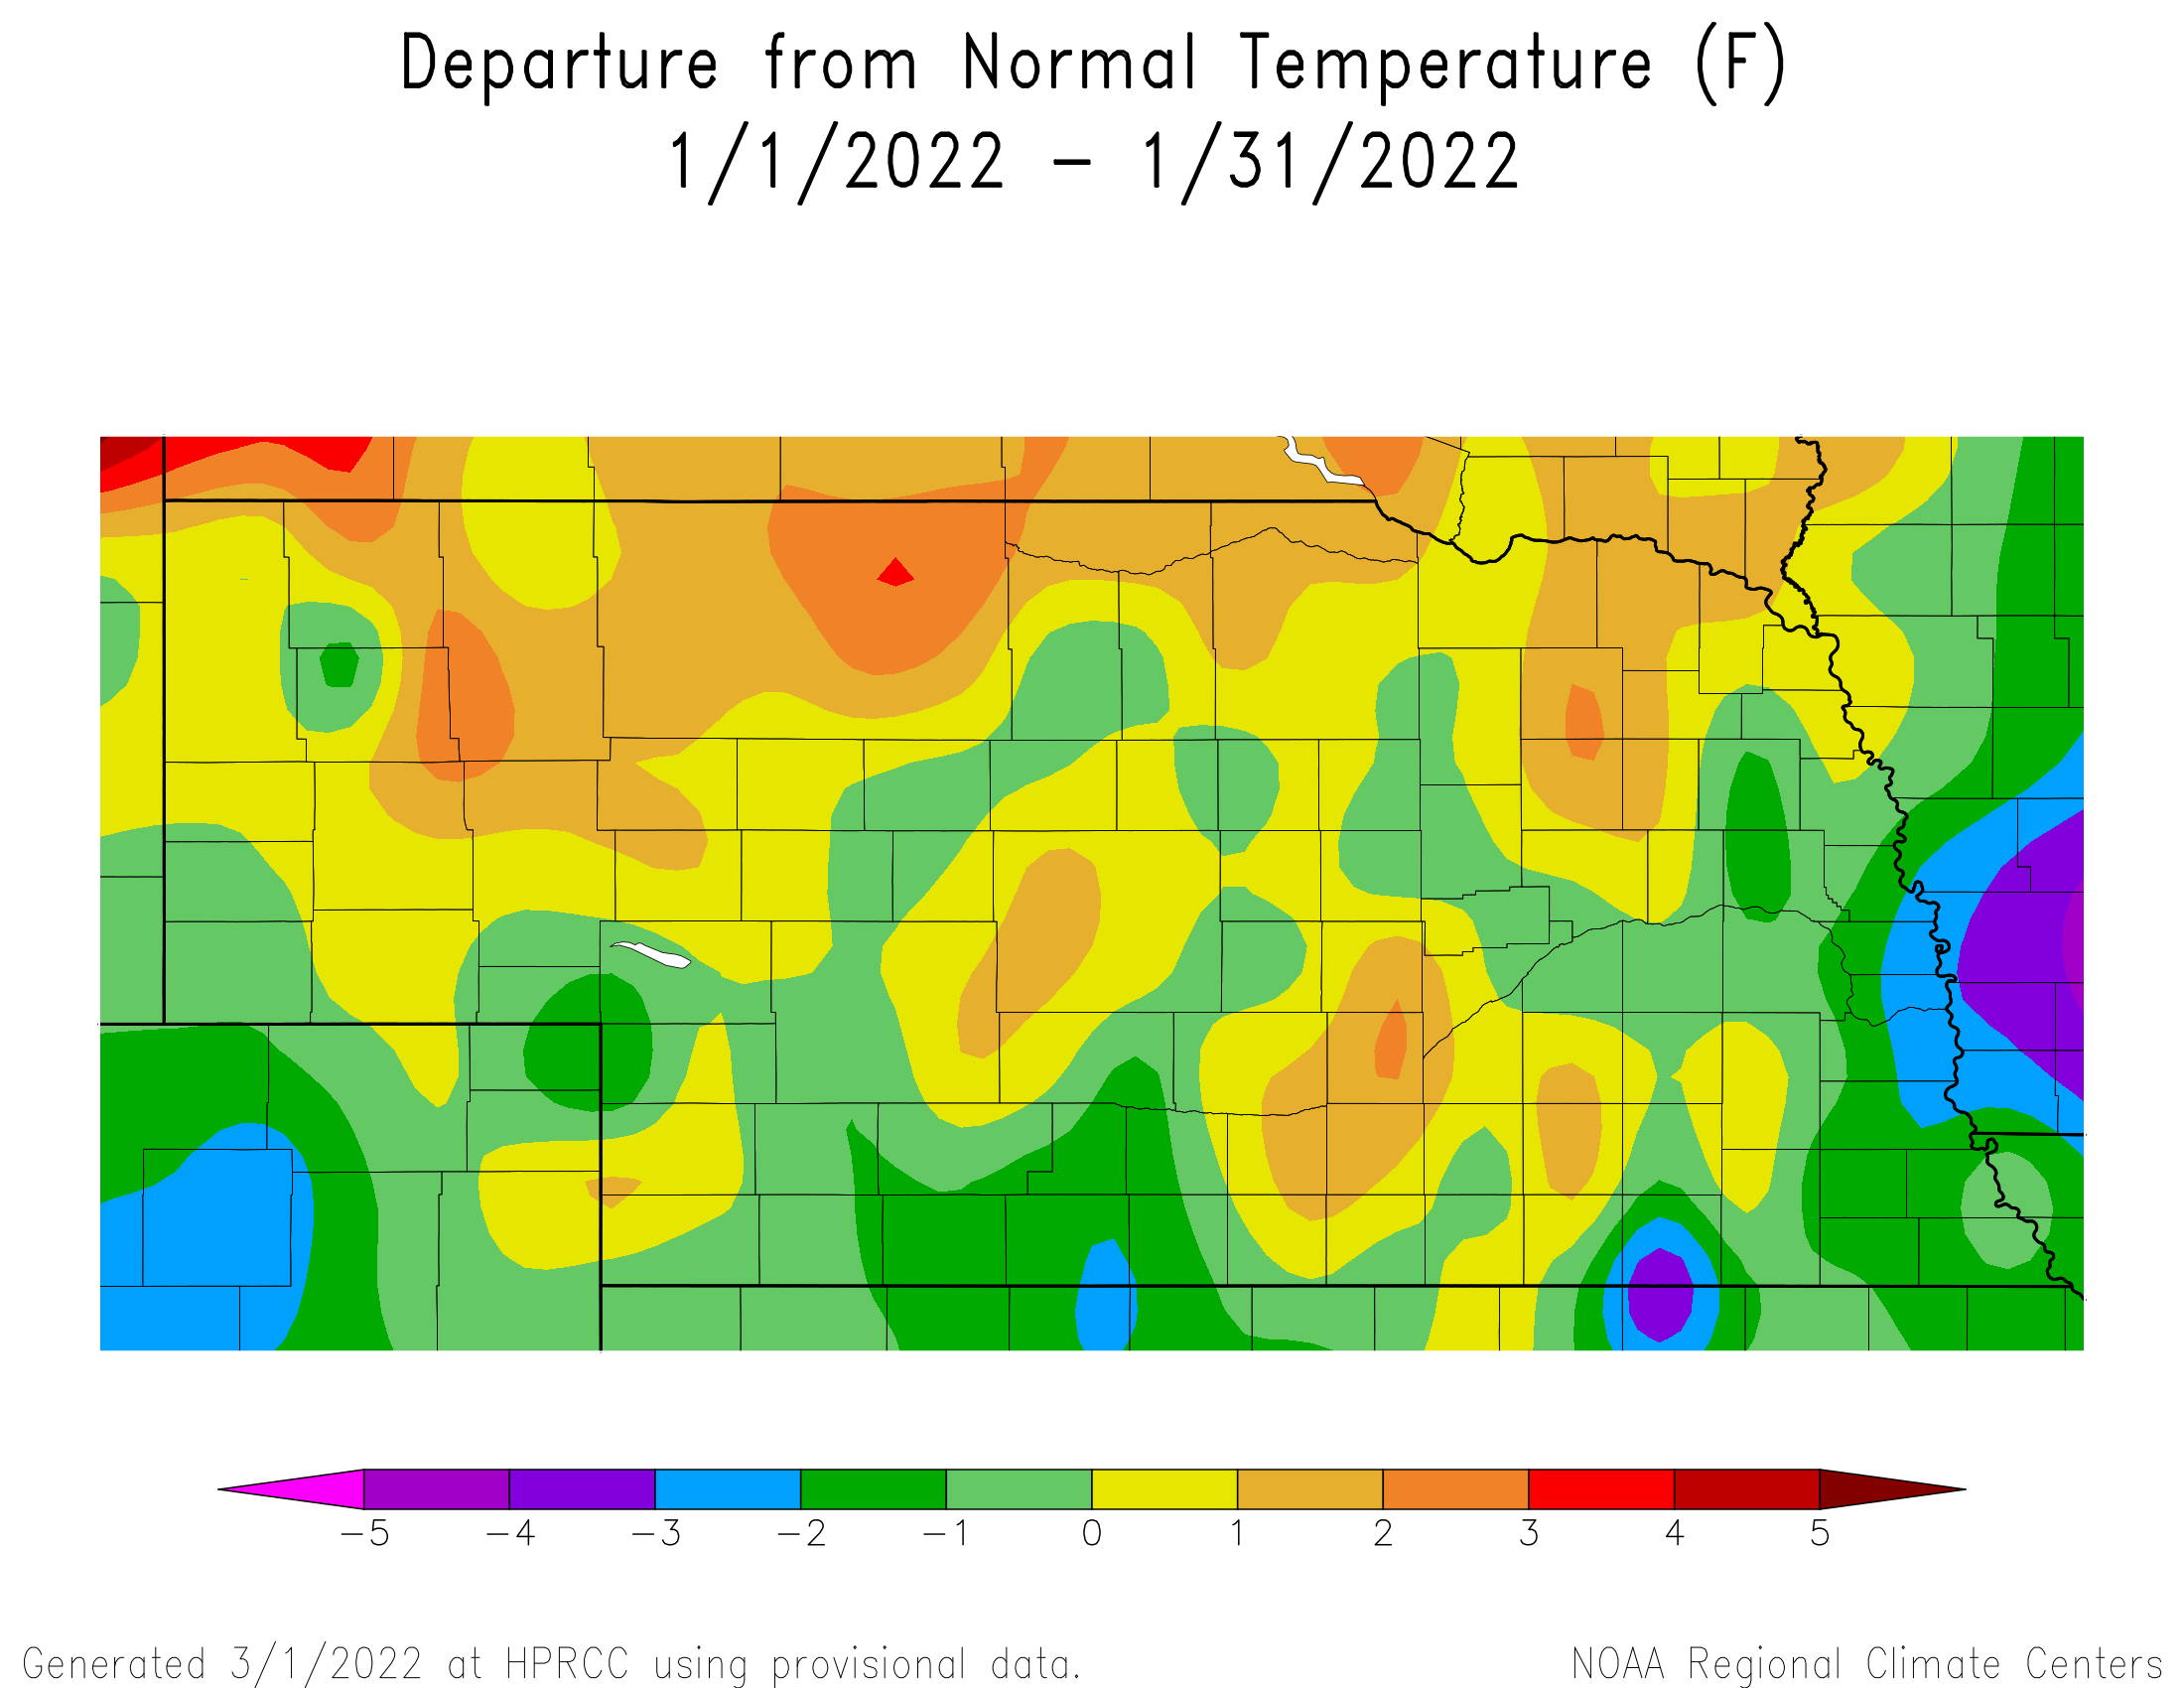
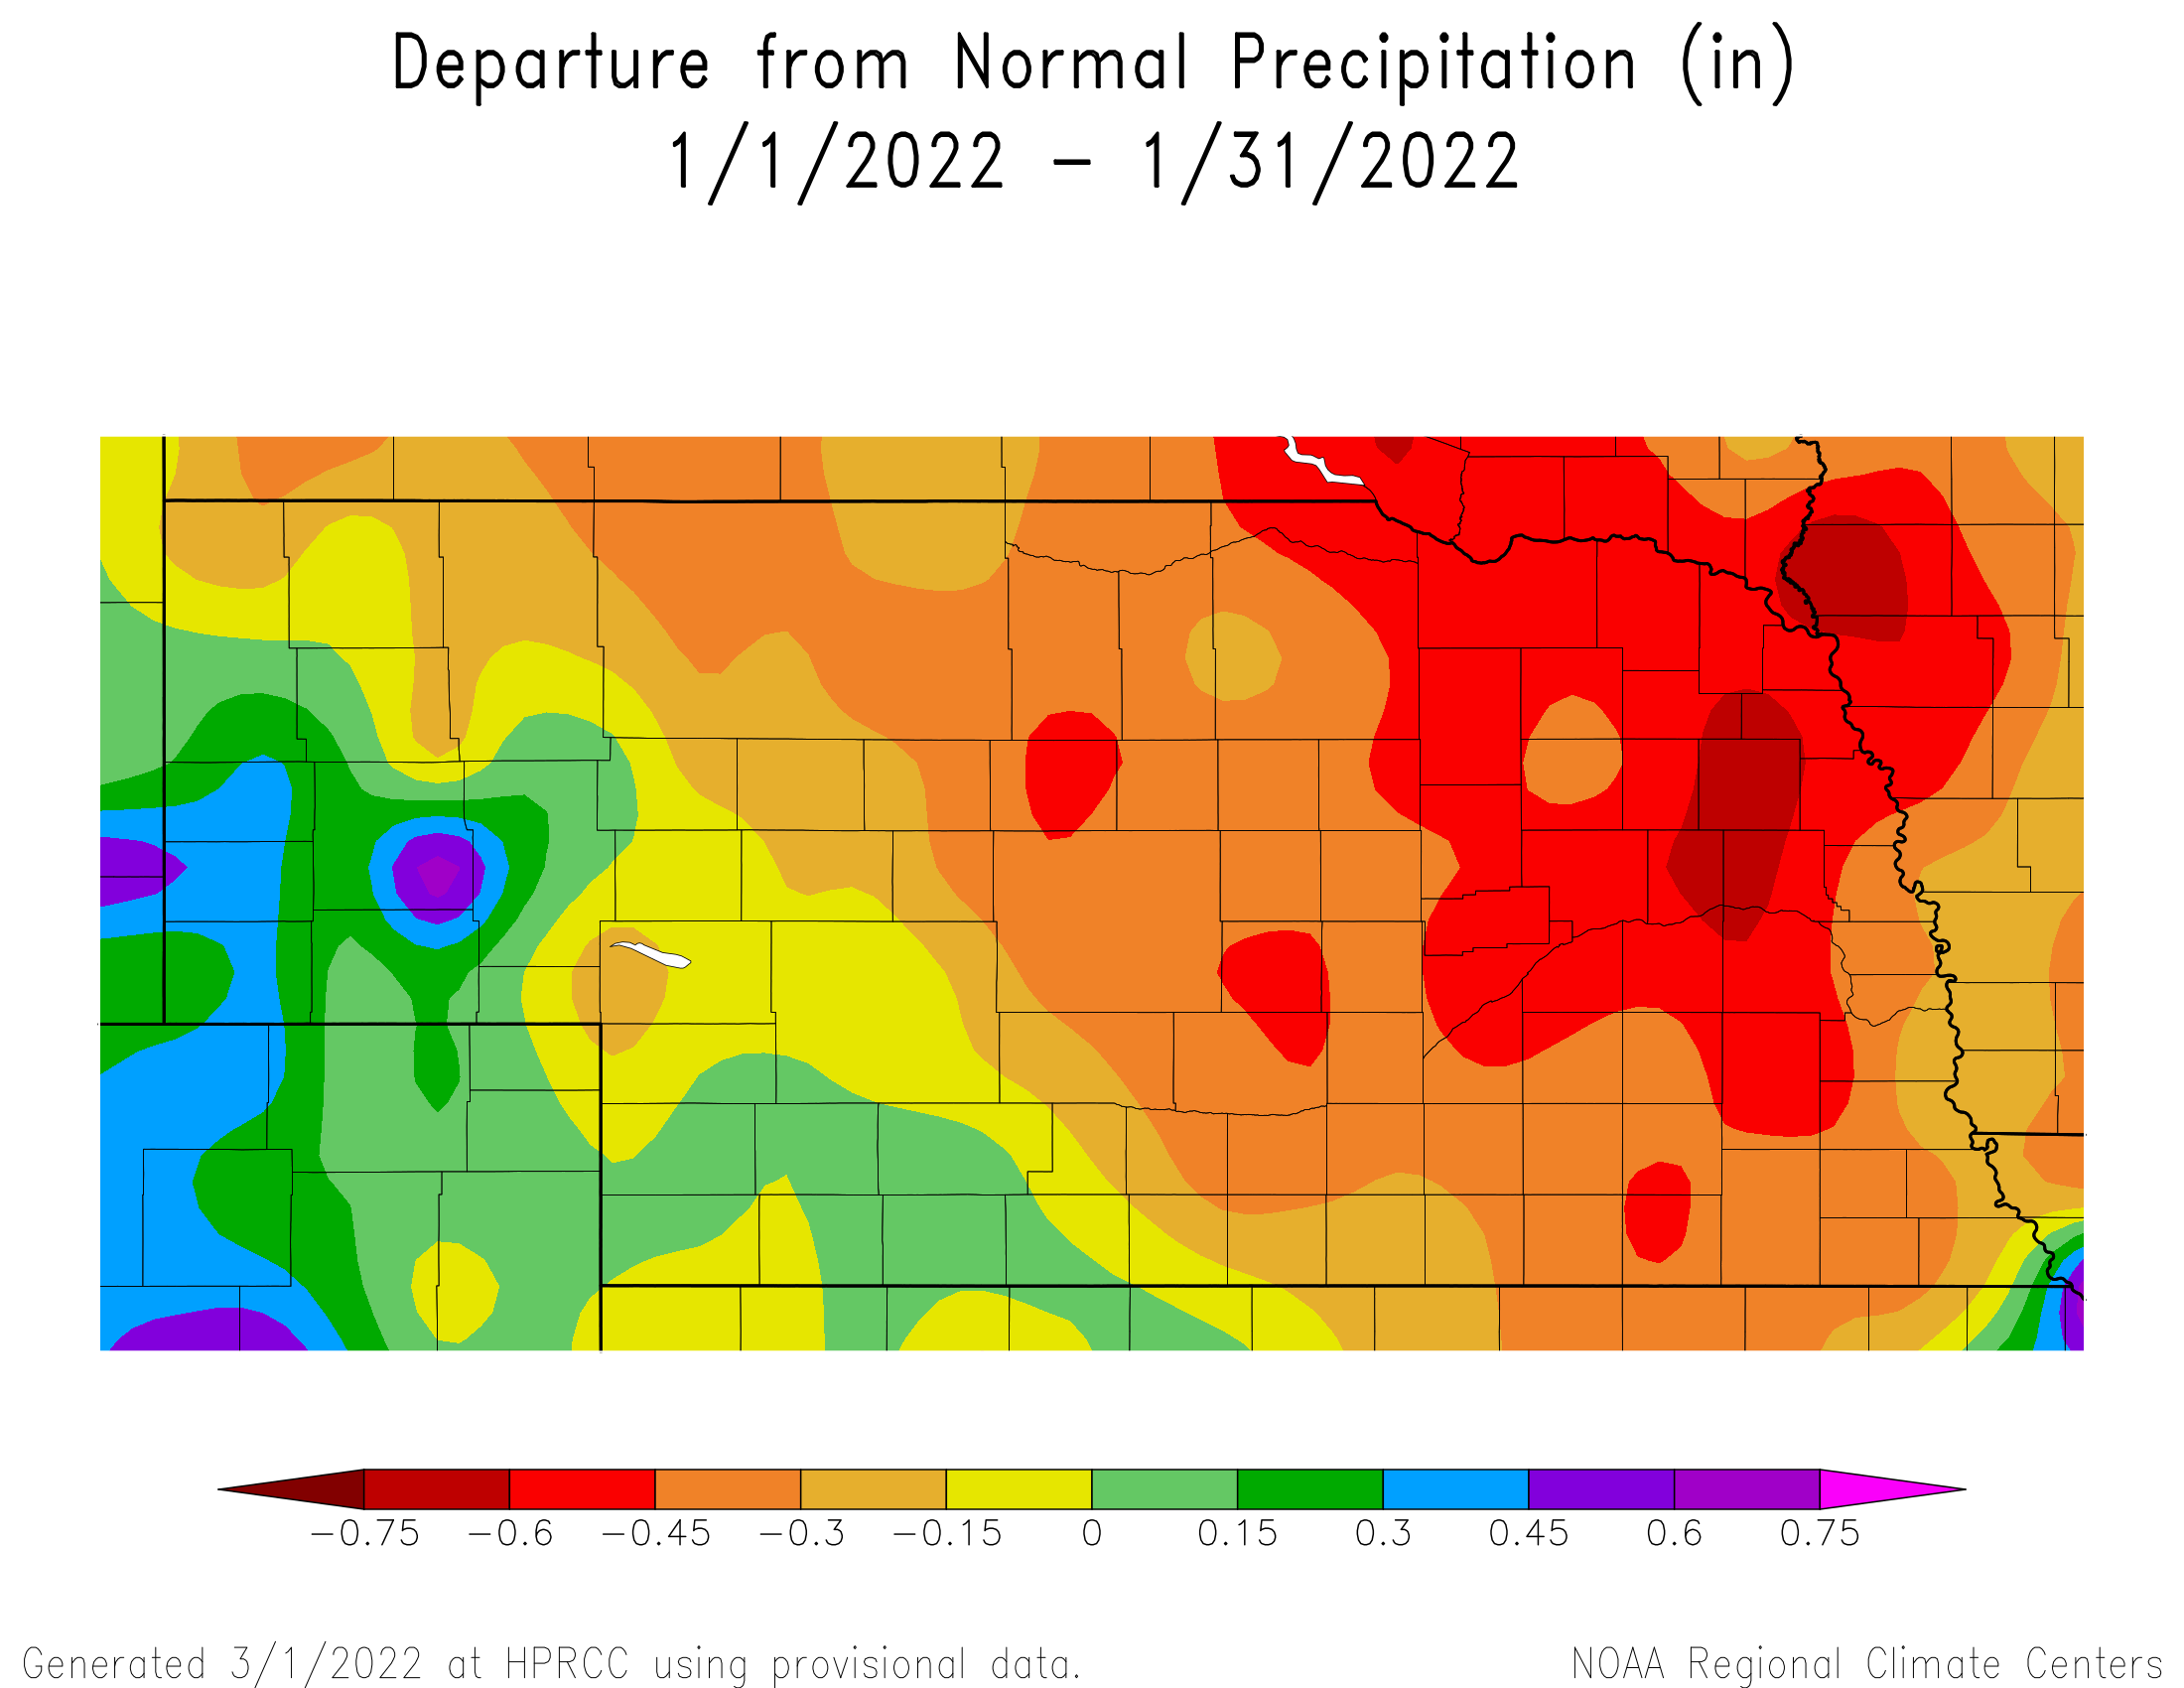
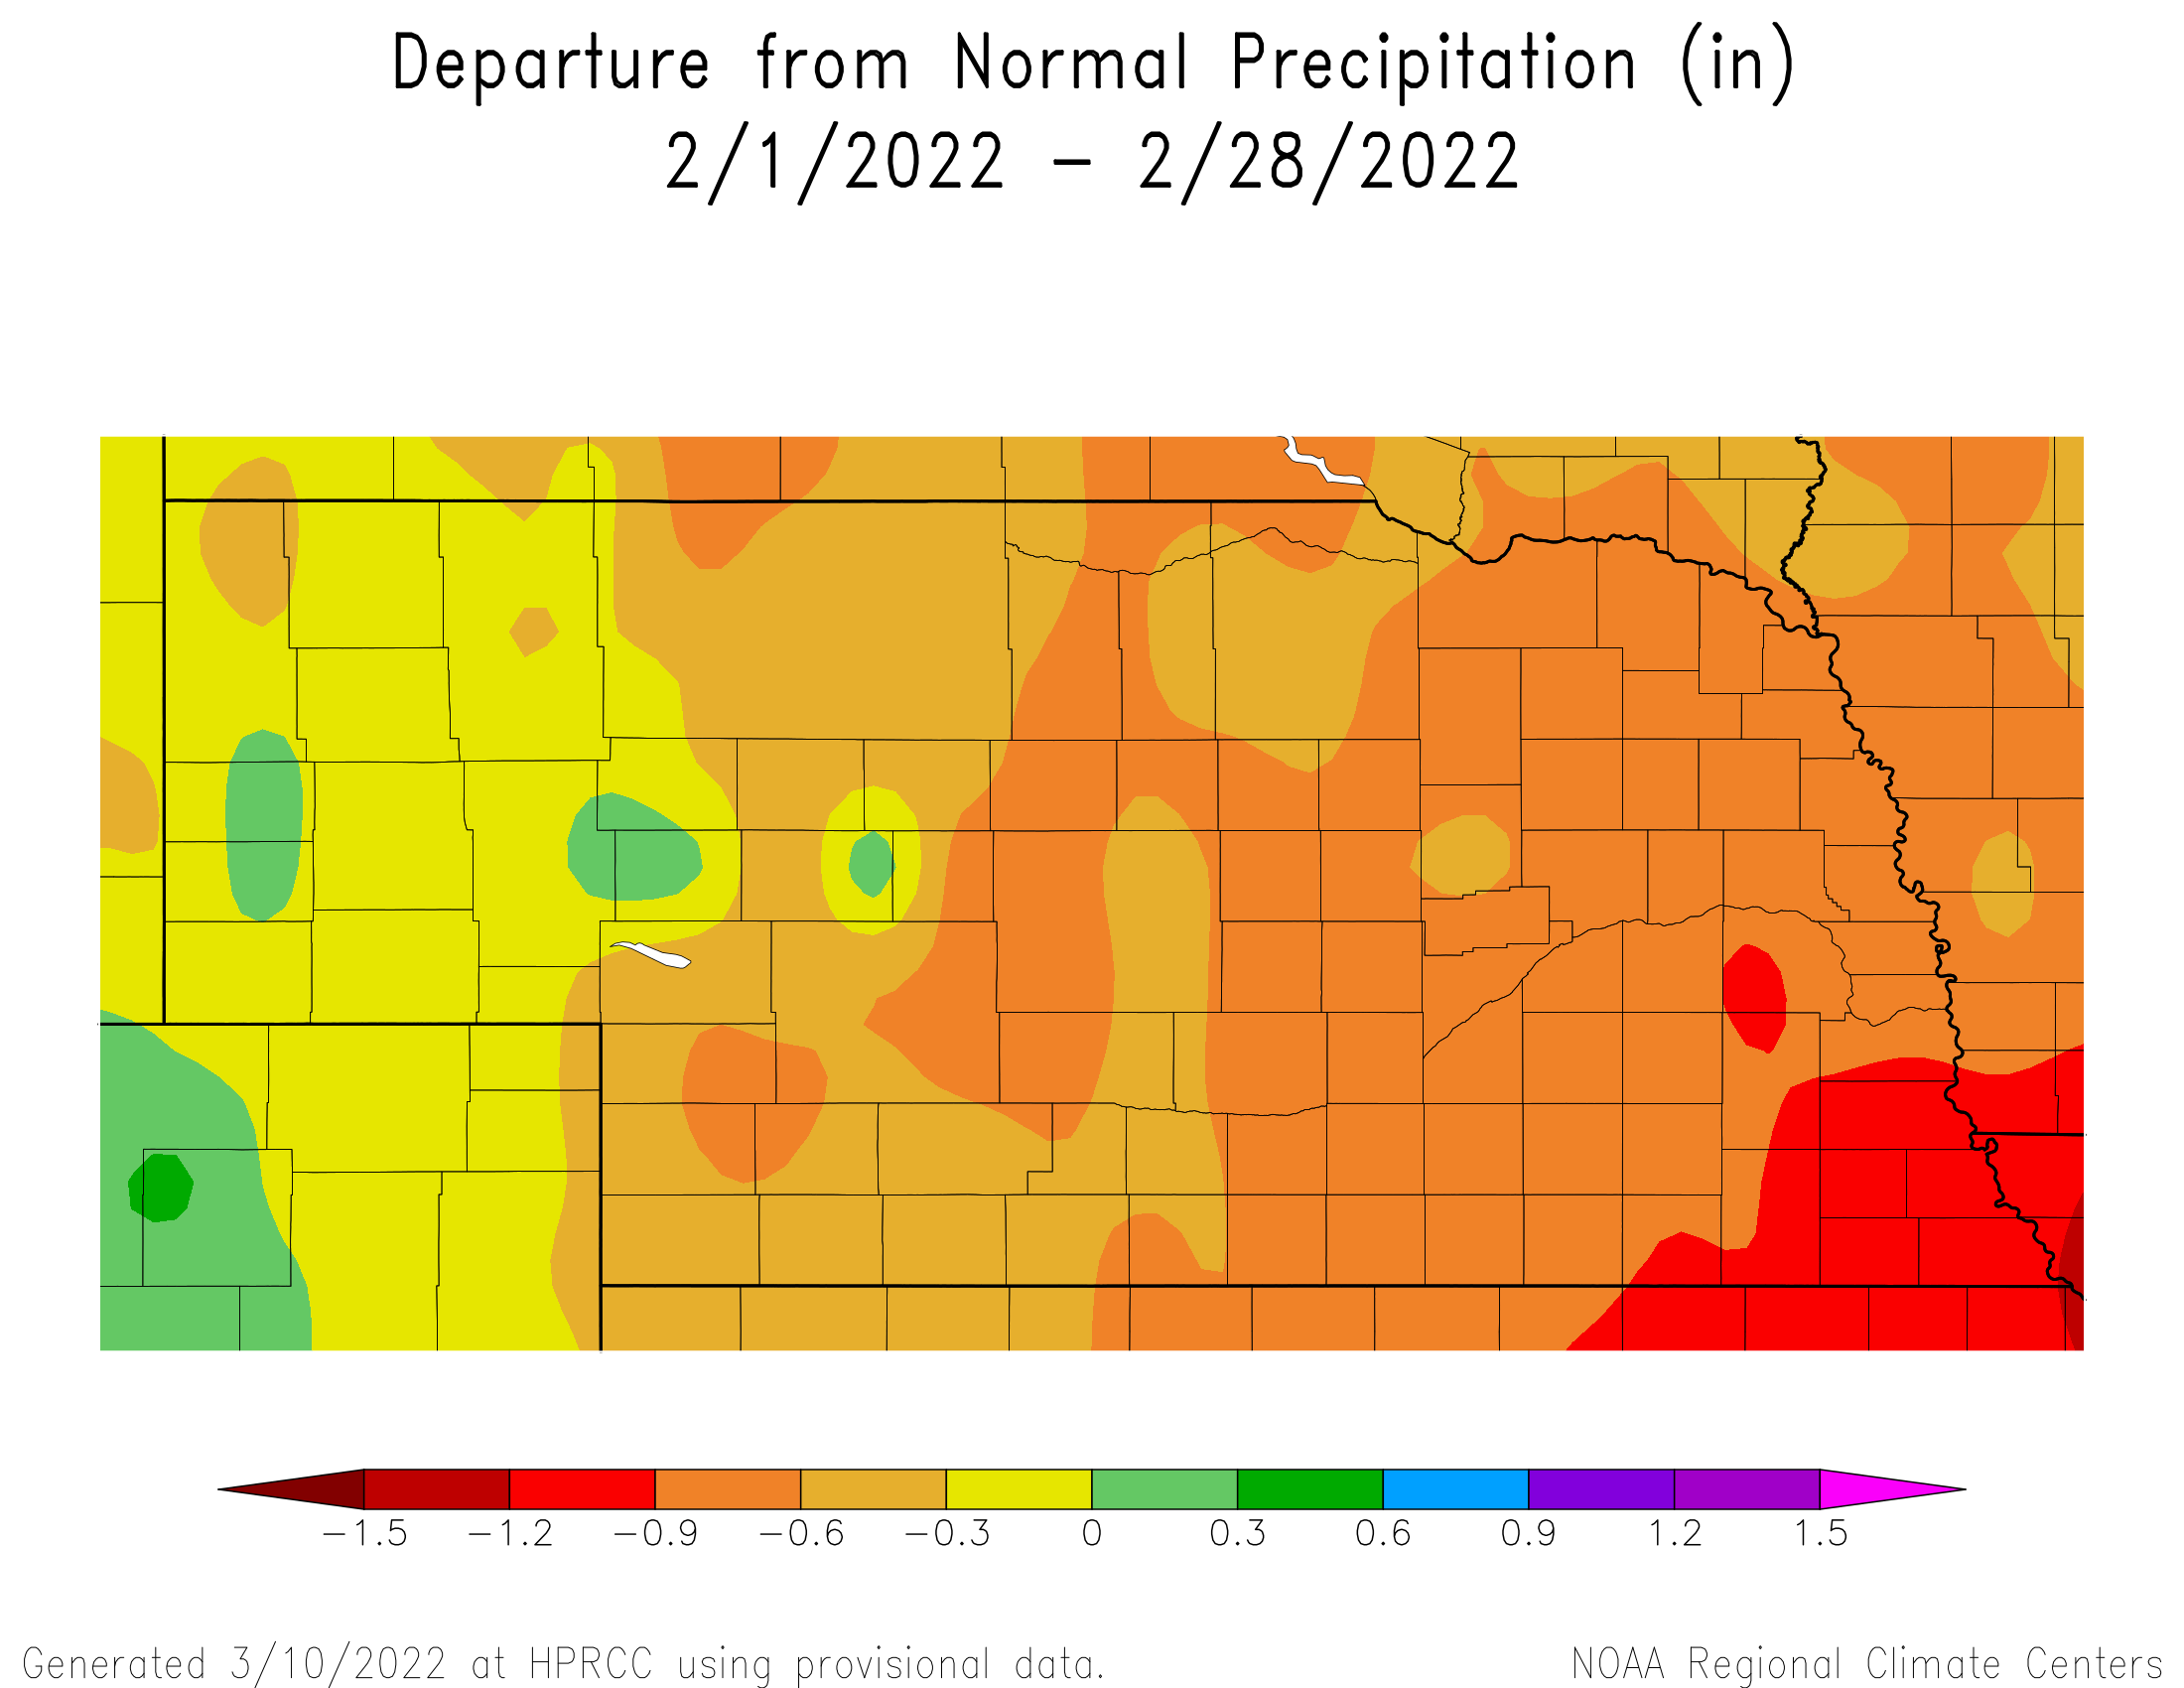
While the upper Midwest experienced bone chilling cold and frequent snow activity, the atmosphere was too dry west of the trough to support moisture events. In essence, January and February were dominated by Alberta Clippers without the snowfall across Nebraska. As the upper air trough strengthened through January, statewide average temperature anomalies were closer to normal in January and below normal during February (Figures 6 and 8).
With the primary upper air flow on the backside of the upper air trough out of the northwest, continental air masses moving southward out of Canada kept low level moisture drier than normal. Thus, precipitation during January and February was below normal for the vast majority of the state (Figures 7 and 9). If the accumulated precipitation deficits this winter and last fall are followed with a similar pattern this spring, widespread drought intensification would be favored as the summer approaches. Hopefully, the recent movement to more storm activity entering the western United States will translate into a beneficial precipitation pattern this spring.
Al Dutcher, Agricultural Extension Climatologist with the Nebraska State Climate Office
