Drought continues to improve
The most recent U.S. Drought Monitor, which was released yesterday and based on data through early Tuesday morning, shows only 25 percent of the state is in drought. This is the least amount of drought in the state in almost a year and a remarkable improvement from three months ago when almost 90 percent of the state was in drought.
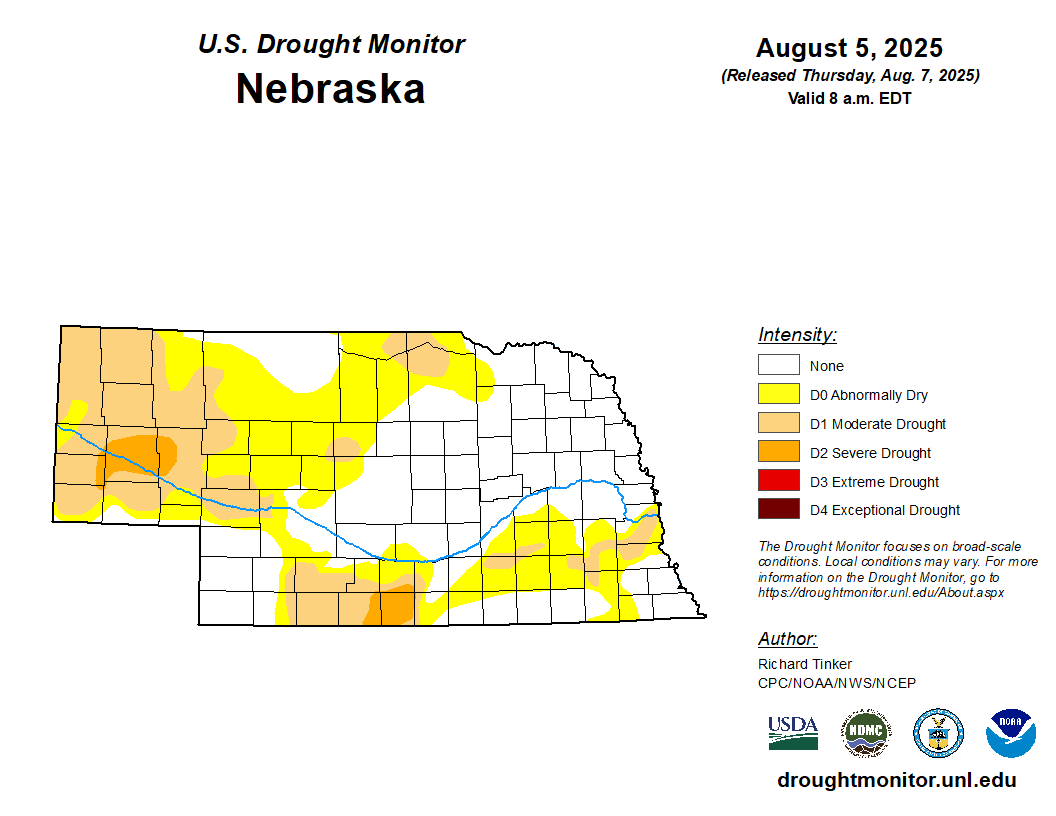
Figure 1. Latest U.S. Drought Monitor
Well above average precipitation
Summer is not the most common season to see significant drought improvement (though the summer of 2023 also saw a lot of improvement) and it was not the expectation going into the summer. Precipitation started becoming more frequent in the last part of May and then the faucet really turned on after the summer solstice. For the period from June 23rd through August 7th, only the Panhandle hasn't been above average. Furthermore, the central and eastern climate divisions were top 5 wet and the northeast climate division was record wet.
Figure 2. Precipitation ranks by climate division for the period from June 23rd-August 7th.
Soil moisture improvements
The latest NASA GRACE root zone soil moisture percentiles show that most of the state is wet, with only isolated pockets below the 30th percentile (Fig 3a). This is a significant change over three months ago when much of the state was in the driest 10th percentile and central Nebraska was mostly in the 2nd percentile (Fig. 3b). These improvements have not been limited to just Nebraska either. Most of the north central U.S. and certainly the Western Corn Belt was quite dry three months ago. The antecedent drought conditions may be the only thing that has kept parts of Nebraska, South Dakota, and Iowa from having some flooding issues this summer.
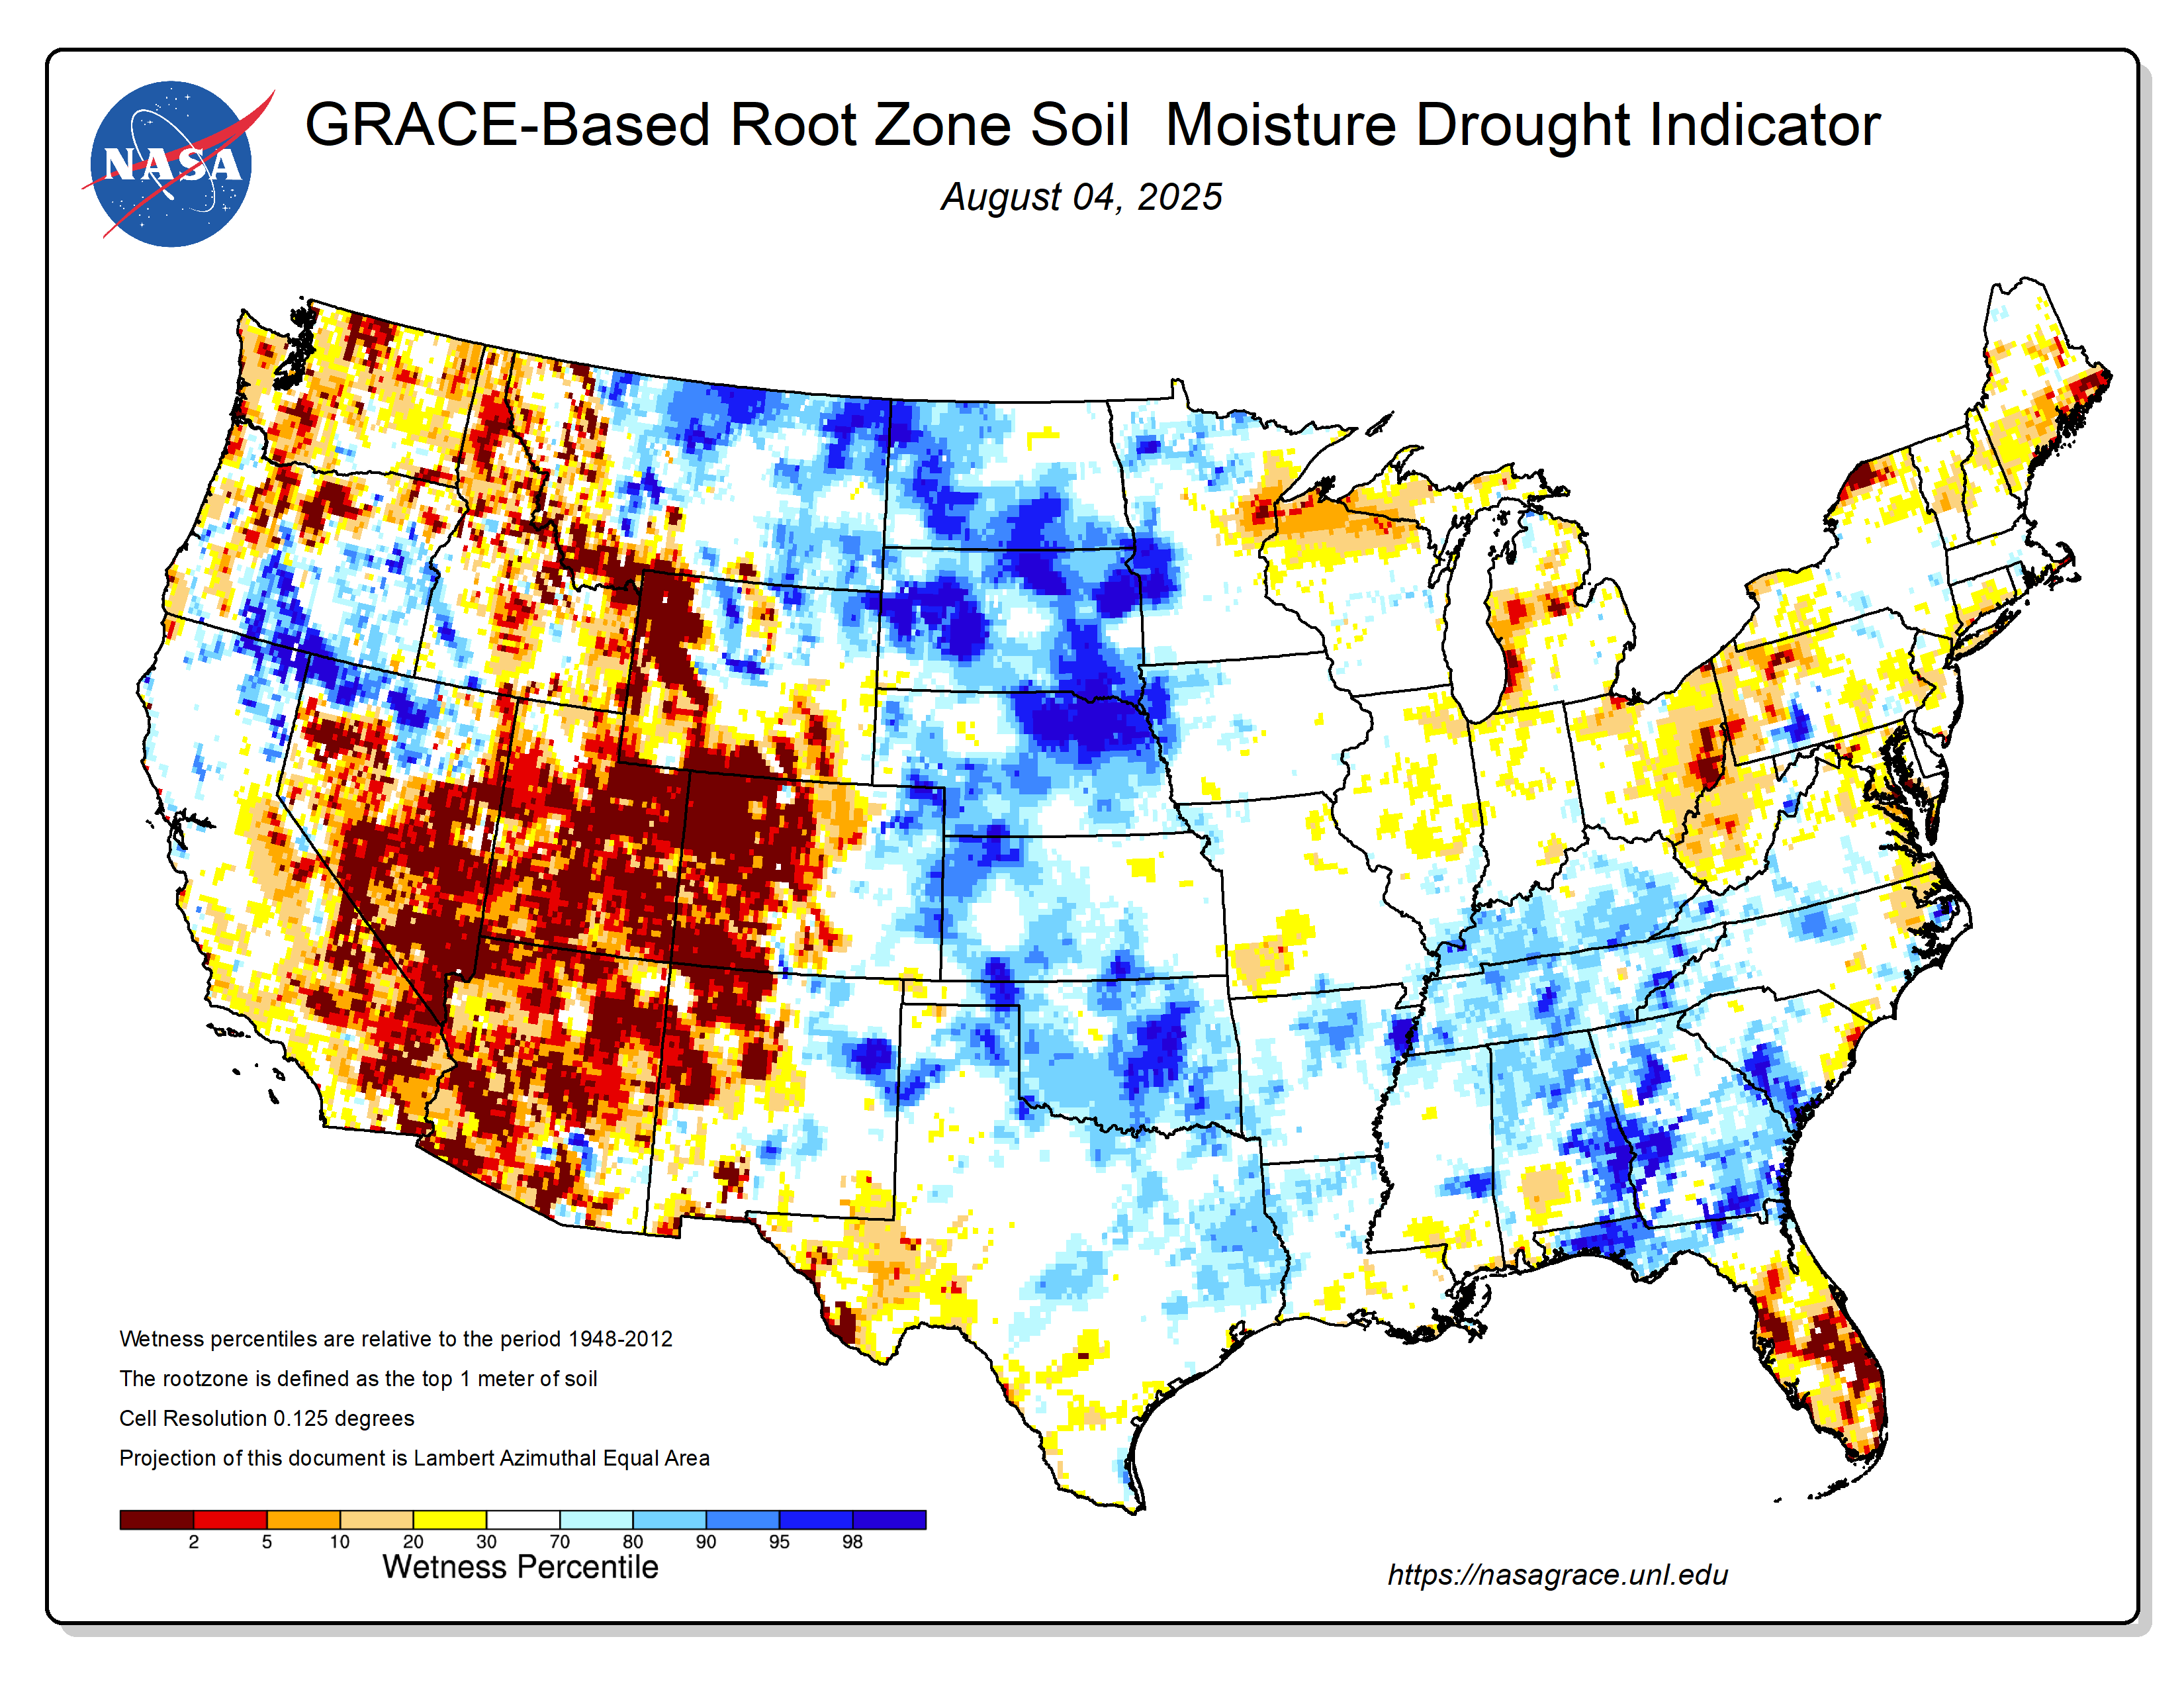
Figure 3a. Latest NASA GRACE root zone soil moisture percentiles
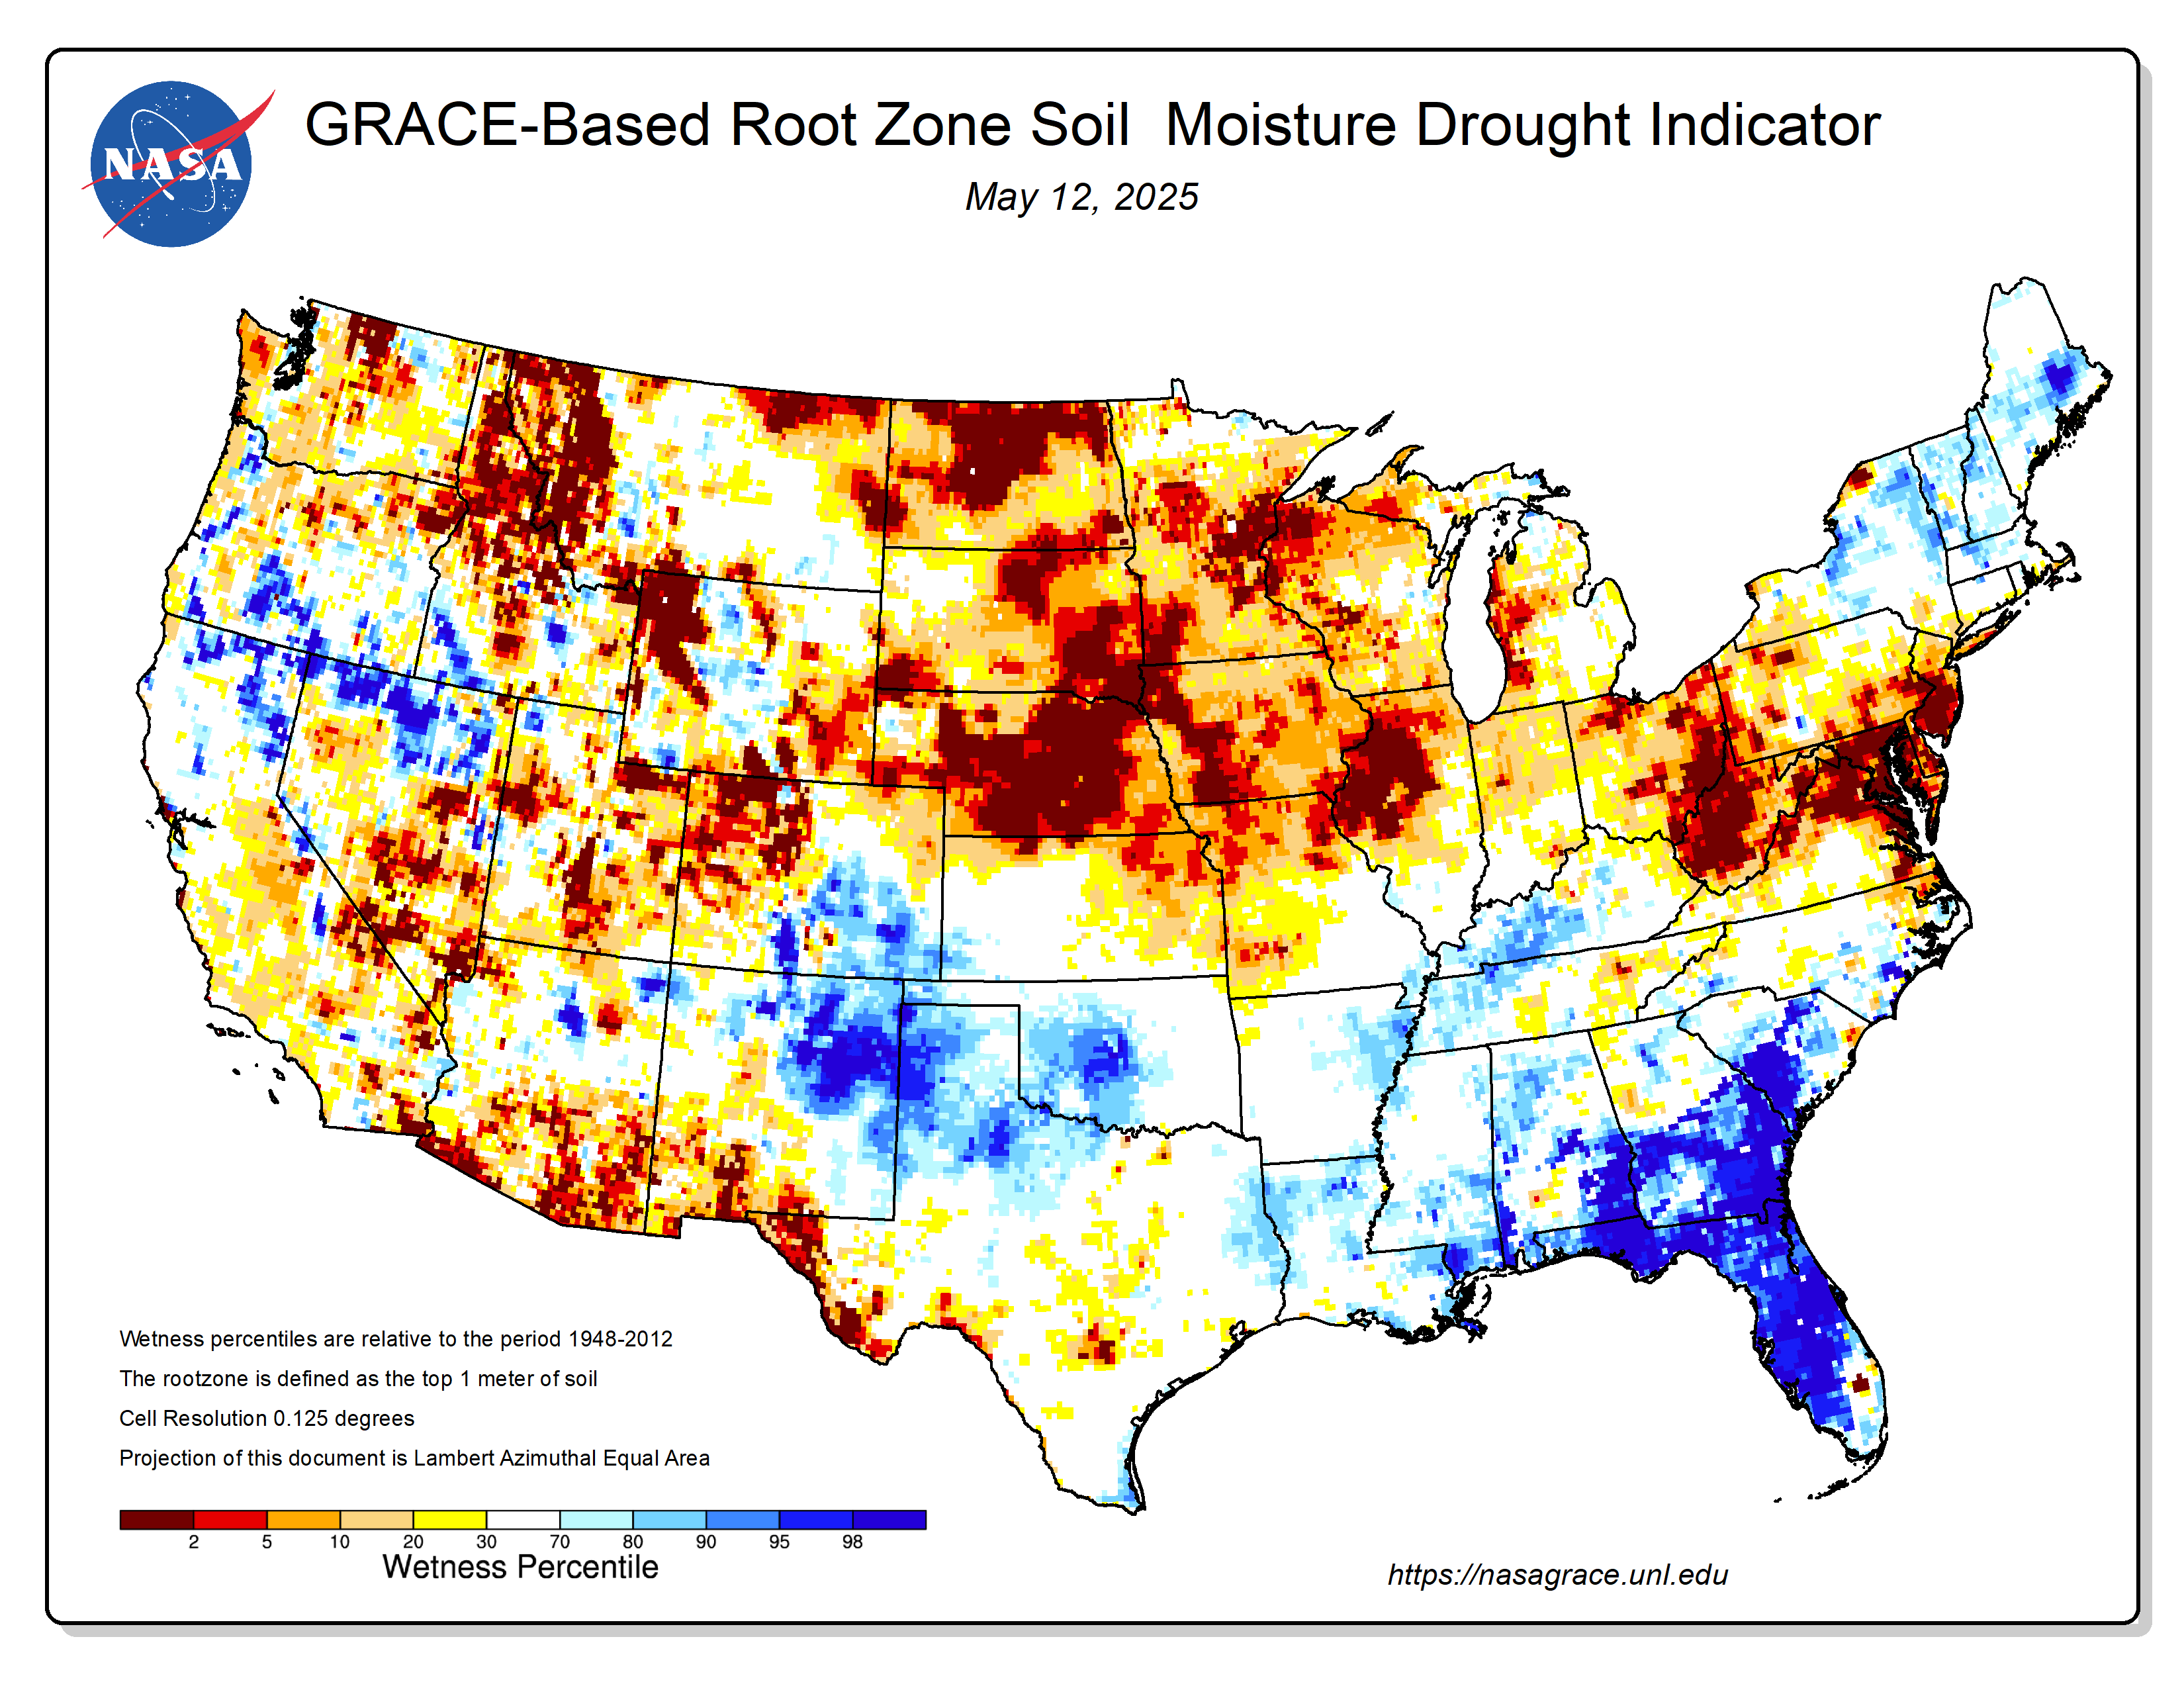
Figure 3b. NASA GRACE root zone soil moisture percentiles from May 12, 2025
Record crop yields?
The USDA WASDE report is due early next week and will include the first official estimate of U.S. corn and soybean yields for 2025. Other analysis estimates from firms like StoneX that have come out in recent days suggest record yields are likely. The reason for optimism are the stellar ratings across the Corn Belt and analysis from products like QuickDRI, which combine satellite analysis of vegetation health and short-term precipitation to offer a snapshot of where crops may be stressed.
Areas in blue are more likely to be lush with healthy crops while areas in the yellow and orange are more likely to have more stress than usual. Outside of small pockets of the southwest Panhandle and around Harlan County, most of Nebraska is depicted as being normal or wetter than average by QuickDRI. A look at the broader region shows that normal and wetter than average conditions are very dominant right now. QuickDRI is not a perfect predictor of yields but it is useful at showing where conditions are sub-optimal and downright terrible.
Figure 4 shows the StoneX corn and soybean yield estimates overlaid onto QuickDRI. Five states, including Nebraska, are currently projected to have 200 bpa or higher corn yields and Nebraska, Iowa, Illinois, and Indiana are expected to clear 60 bpa on soybean. For Nebraska, a statewide corn yield of 205 bpa would obliterate the old record of 191 bpa set in 2021 (a year I suggested back in February was a potentially useful analog) and a statewide soybean yield of 63 bpa would tie the record set in 2021.
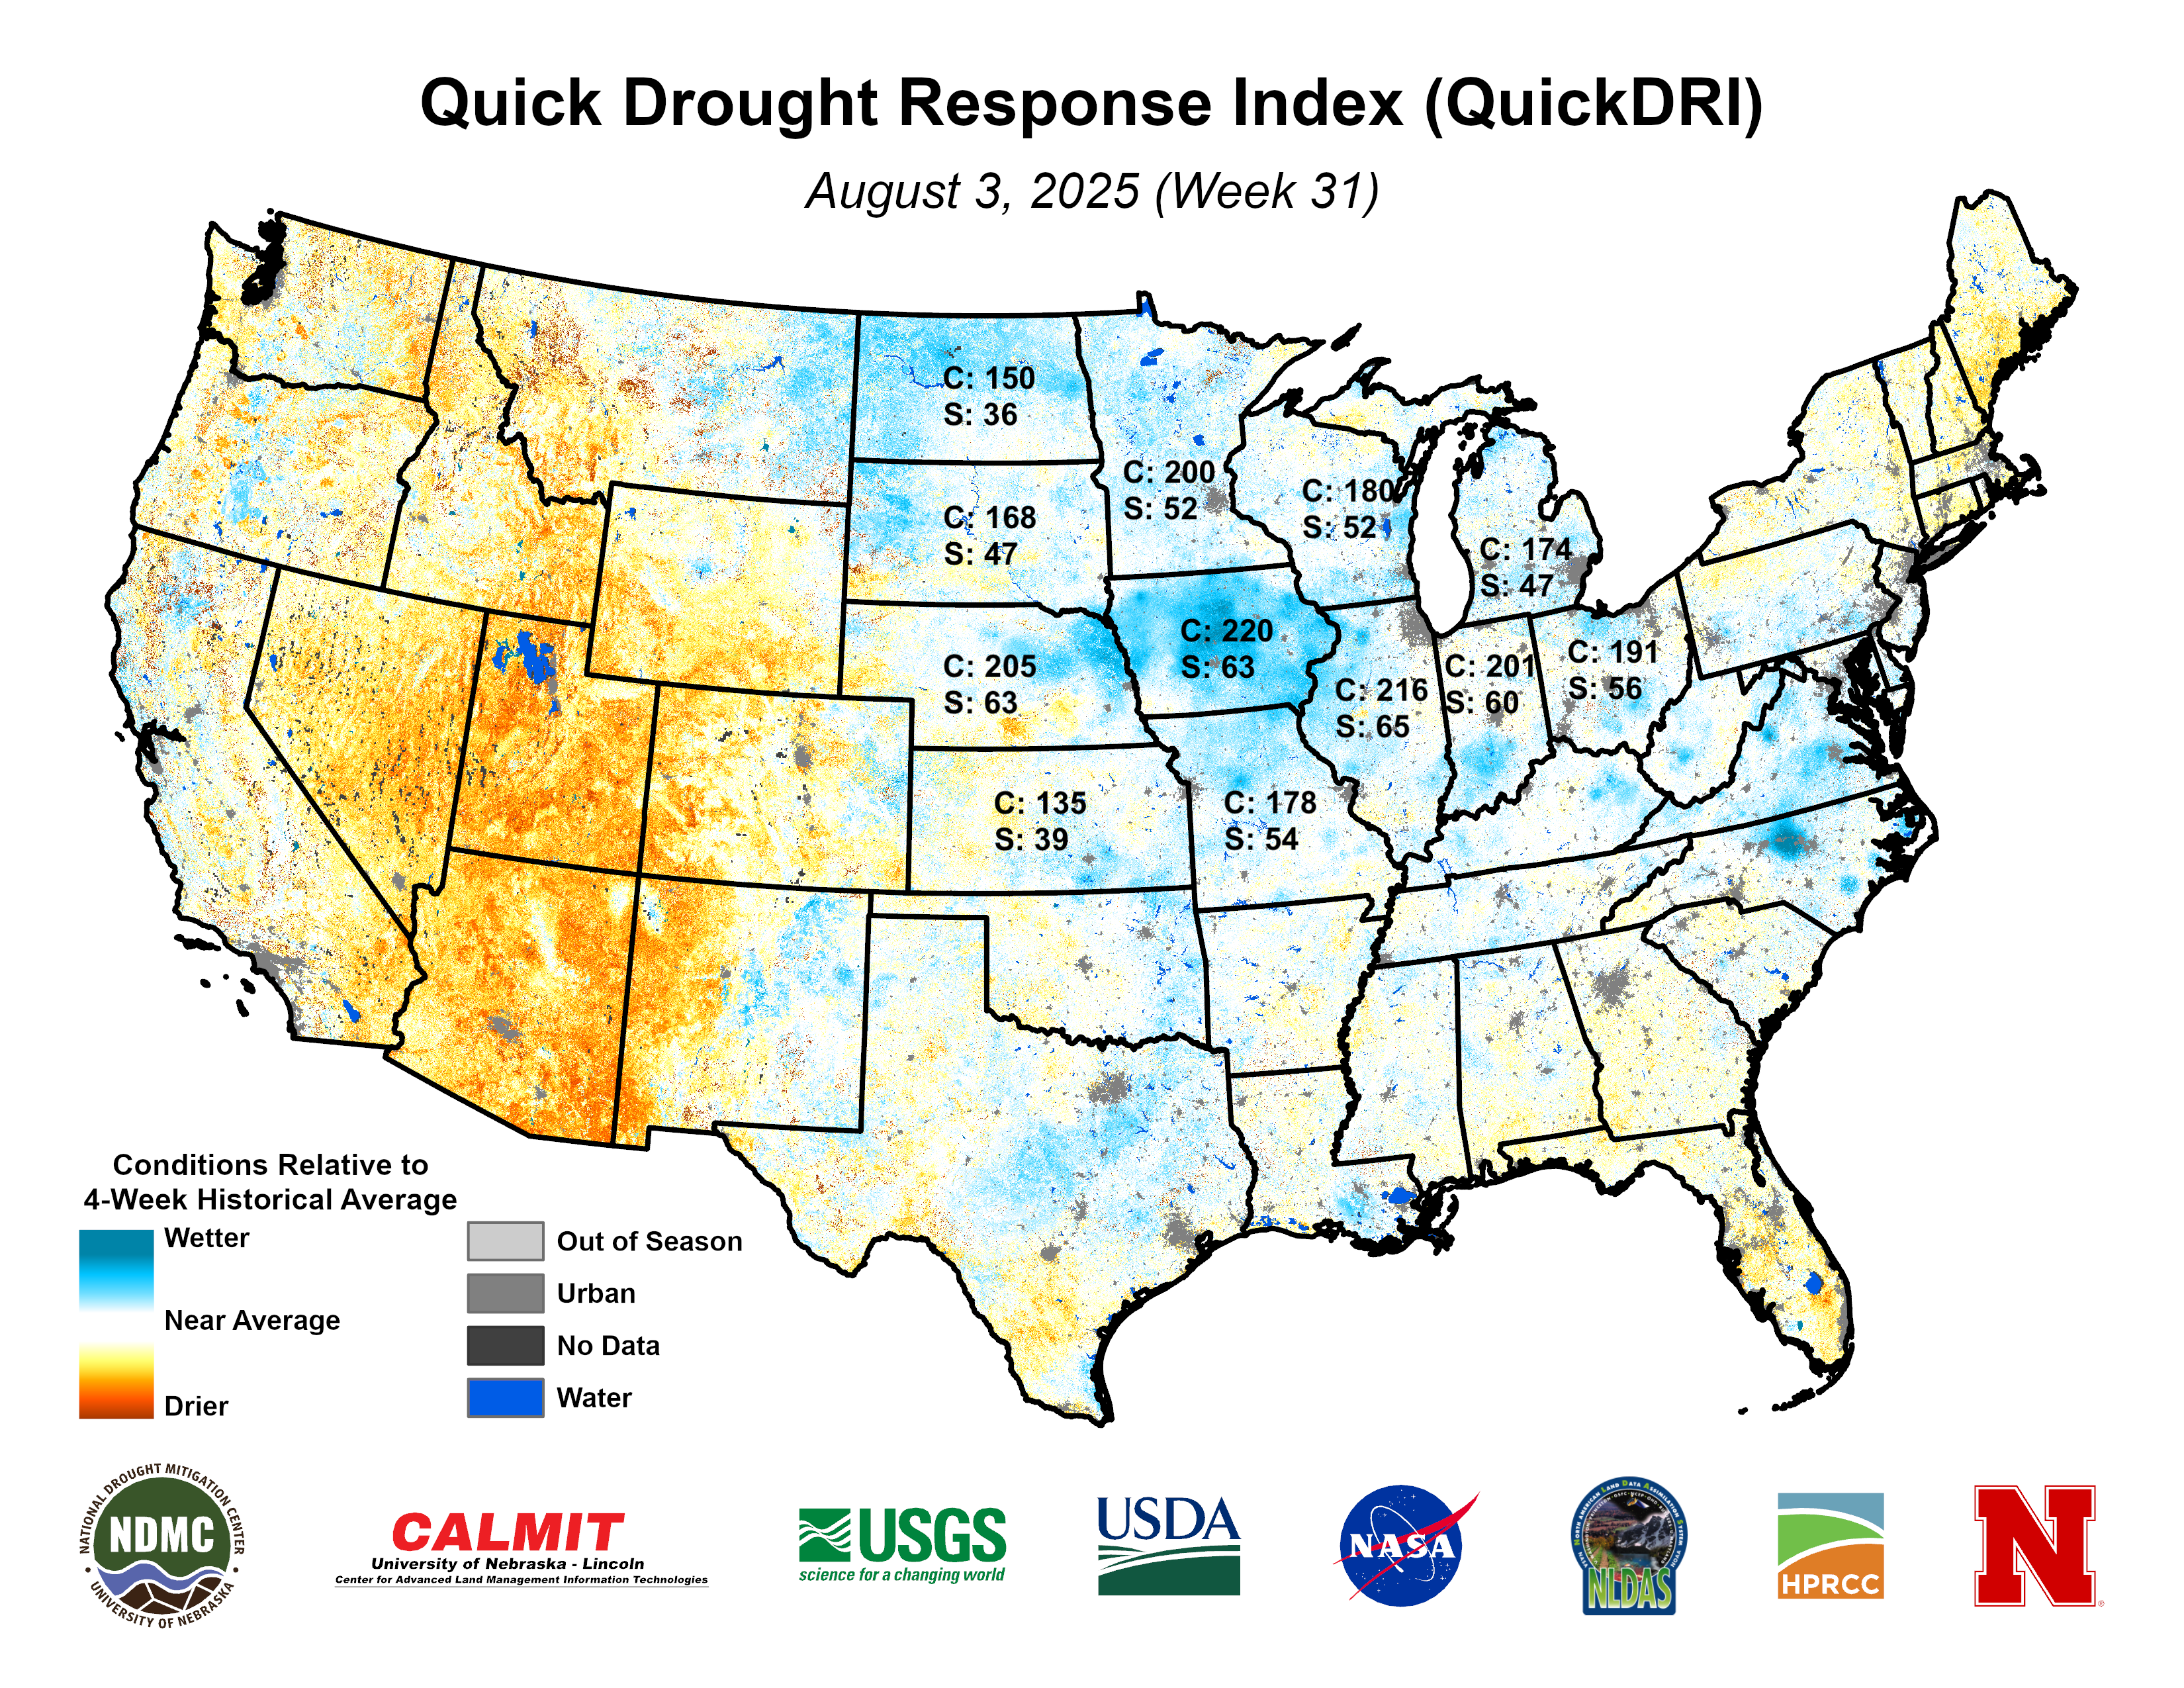
Figure 4. Latest QuickDRI map overlaid with StoneX yield projections for Midwest states
Dry spring to wet summer
The expansiveness of the Bermuda High this summer, the wetter conditions to our south/southeast going into summer, and an upper-air pattern that hasn't gotten "stuck" for long stretches of time have all contributed to the regular occurrences of rain this summer for central/eastern Nebraska and much of the Corn Belt. It has not been a cool summer (nights have been a bit warm for most) but the hot days have come in pulses, not batches. Perhaps the most important factor though is that it wasn't a super wet spring for central IL and points north and west. A lot of crops got in early or at least on time and weren't dealing with waterlogged soils in May and early June. The flip from a drier spring to a wet mid-summer is somewhat comparable to 1992, though the temperature difference makes that comparison with this summer fairly tenuous. 1992 was much cooler as shown in Figure 5.
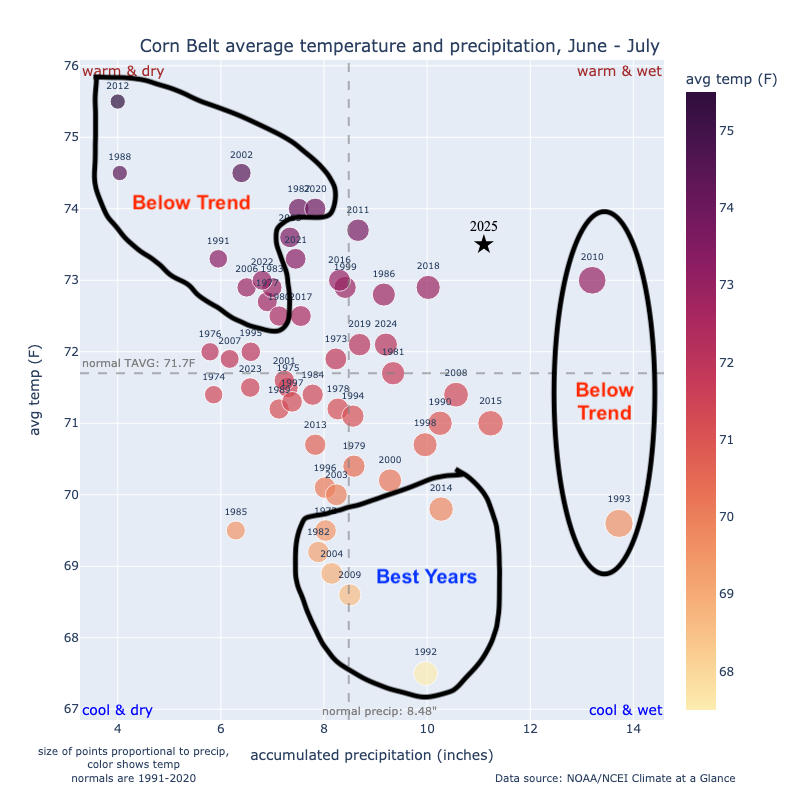
Figure 5. Temperature and precipitation quad chart for summers since 1971.
The faucet doesn't appear to be shutting off in the Corn Belt in the immediate future but we may be dealing with more heat and humidity than is optimal later this month. Doubt it drops yields below new U.S. records but it may make the very high end of trade estimates harder to obtain. Just my two cents!