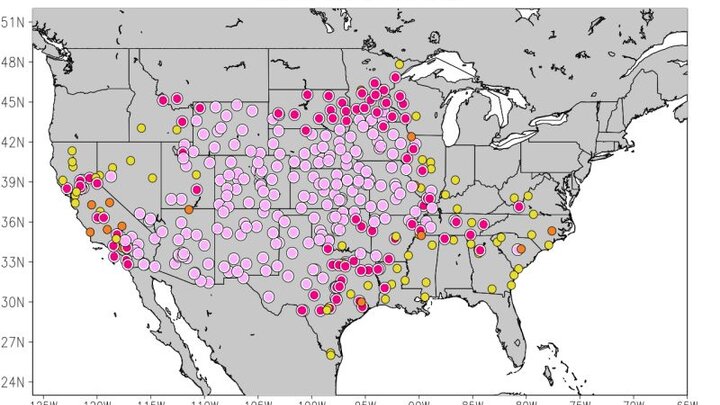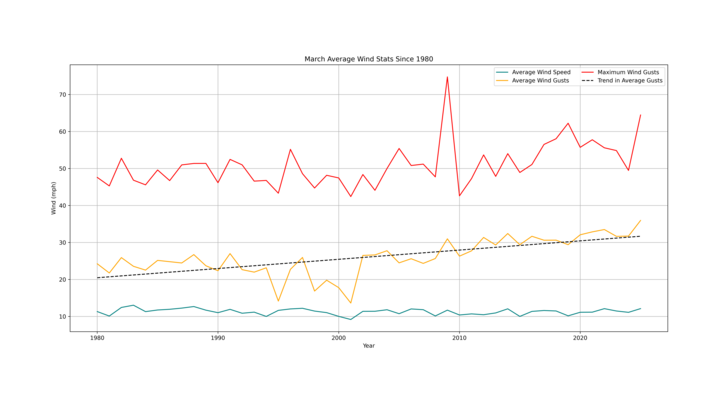
There is a perception in Nebraska and throughout the Midwest that it is getting windier in the early spring. So, we decided to do a short analysis using data from eight stations around the state to determine if that is true. A climatology of our wind speed data going back forty five years shows that this perception is partially true. Since 1985, the average wind speeds (for stations we analyzed) in Nebraska for the month of March have remained steady or decreased just slightly (Figure 2, blue line). But since 2000, there has been a significant increase in the average wind gusts in March (yellow line) and an upward trend in the maximum wind gusts (red line). Out of the eight stations, Grand Island, Lincoln, and Omaha showed the most drastic trends in terms of average wind gusts.
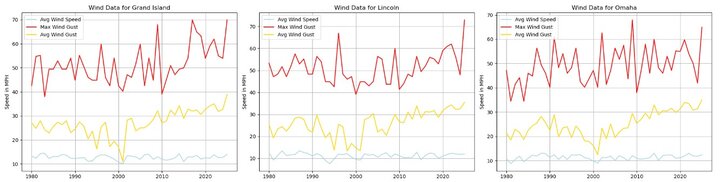
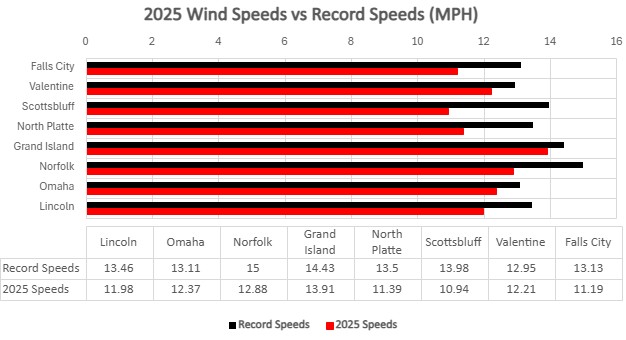
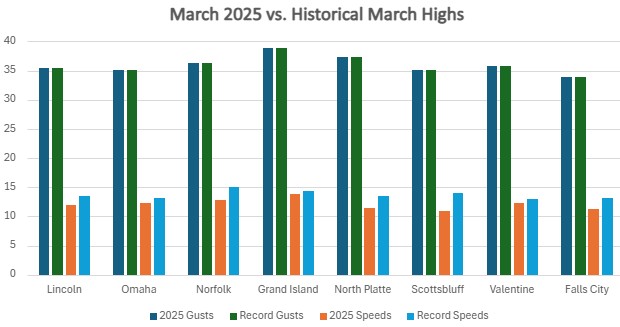
This upward trend in average wind gusts has been particularly pronounced in recent years and was record setting at several sites this year (Figure 4). Several sites around the state either were at or near record levels for maximum wind gusts for the month of March in 2025. But a look at comparison of March 2025 average wind speed values to the records reveals that the average wind speeds were well short of records (Figure 3). In other words, the average March day is not getting windier overall. But our windy days are getting windier with respect to wind gusts. A continuation of this trend will have impacts to our infrastructure, plants, soil, and human and animal health.
International research has previously highlighted the potential for a ‘global stilling’ by the year 2100 wherein wind speeds overall see a decrease by 10%. Our data shown here is consistent with global climate models. Current trends in Nebraska show a movement towards extremes. Average wind speeds decreasing and gust intensity increasing both reinforce global model predictions. It should be noted, however, that our analysis is isolated to the month of March and not for an entire year. Additional research needs to be done to determine if this part of a larger trend or if March is unique in the disparity between average wind speeds and average wind gusts.
The increased higher wind gusts could also contribute to increased soil erosion in March and the early spring in general if fields are uncovered and are dry. Erosion means loss of overall quality of soil and increased costs for inputs. Keeping "roots in the ground year round" with cover crops would greatly minimize soil erosion as well as reduce need for additional inputs.