Bottom Line Up Front: Record highs more common, while lows increasingly rare in Nebraska
We often hear on the news about record lows and highs. The cold snap in late November last year, or the warm spell across the Midwest to begin the year, are prominent examples of this. But are these extreme temperatures part of a larger trend, or a commonality when living in a region with great temperature swings? The data points to the idea that record-setting days are more and more likely to be record highs than lows.
Shifting Extremes
Across the state, extreme days are increasingly likely to be record highs and increasingly less likely to be record lows. When adding in historical perspectives and the current decade, the picture becomes even more clear: the past decade was unprecedented in the number and type of temperature records set and this decade is on pace to break the 2010's. The most common record to be set in recent decades is, by far, a record maximum temperature.
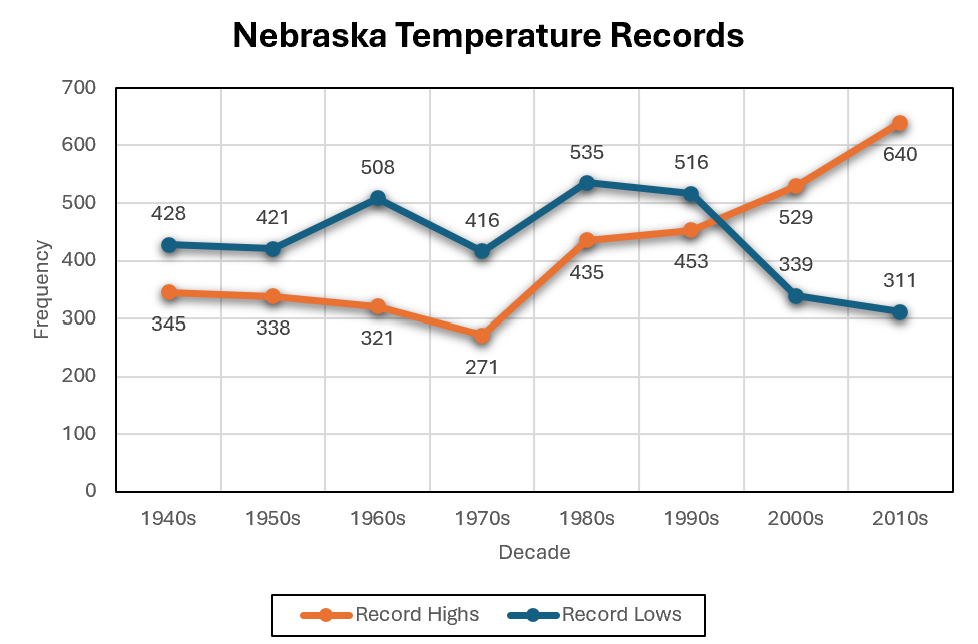
Figure 1: Record temperatures per decade across Nebraska. Record Lows refers to record low temperatures of a specific day, while Record Highs are record high temperatures. Record Lows includes both record low daily maximum and minimum temperatures, and vice versa for Record Highs. Over the last forty years, this chart visualizes how record-setting cold days have declined by over 50%, while record highs have about doubled.
Historically, a record-setting day would only occur once about every 40 days, on average, in Omaha. Over the last 15 years, this rate has consistently climbed closer to once every 25 to 30 days, particularly for record highs. While these rates could be a regional trend in the more urban southeast Nebraska, percentage visualizations across the state tell the same story: extreme warm days are more common.
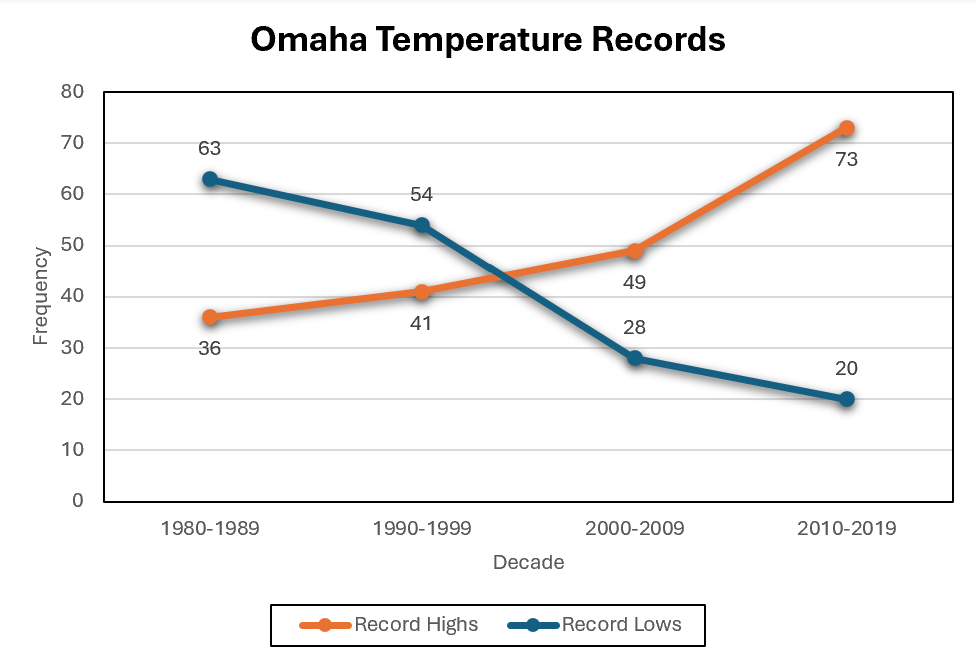
Figure 2: Record temperatures per decade in Omaha, Nebraska. The overall changes in Omaha mirror how record heat is more common throughout the state.
Regional Differences
Across the state, the story remains the same: record highs are increasing, while record lows are often decreasing. Farther in the west of the state, though, data highlights that these changes are more readily felt in the high plains.
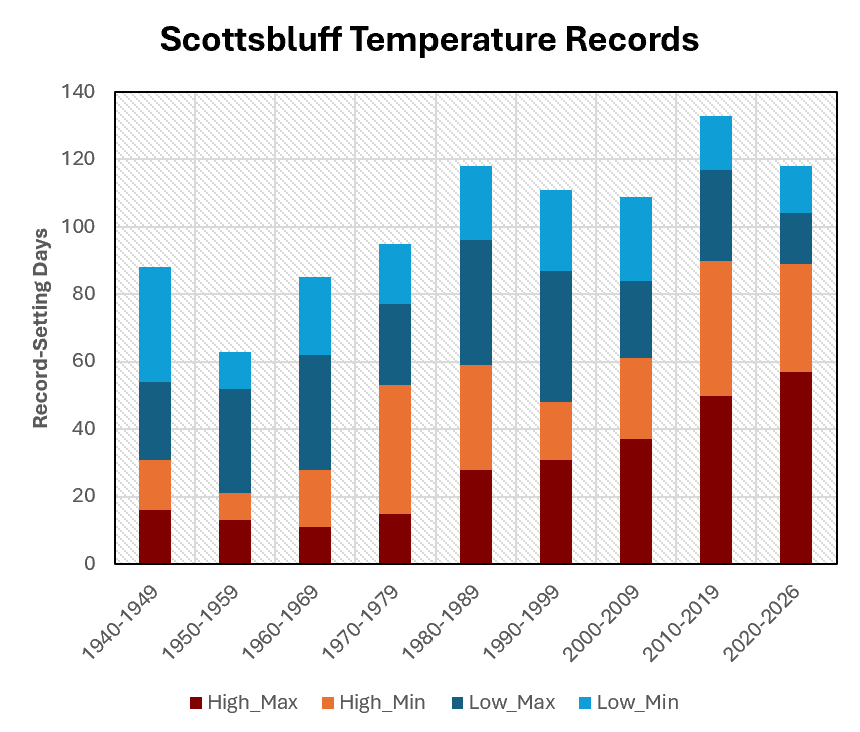
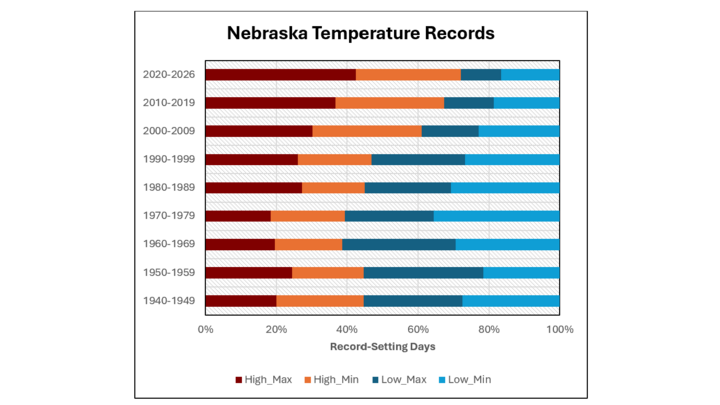
Figure 3: Categorized temperature records ranging from 1940 to present for Scottsbluff, Nebraska. Note the overall increase in record highs compared to eastern Nebraska. High_Max refers to a record high maximum temperature, while High_Min refers to a record high minimum temperature. The same applies for Low_Max and Low_Min, but minimum records.
The Scottsbluff data reveals a pattern consistent with the rest of the state, but with some notable distinctions. In the western high plains, the shift toward record highs appears even more pronounced, possibly due to the region's higher elevation and semi-arid climate making it more sensitive to warming trends. To determine whether this pattern holds across Nebraska's northern reaches, examining data from Valentine provides a useful comparison point.
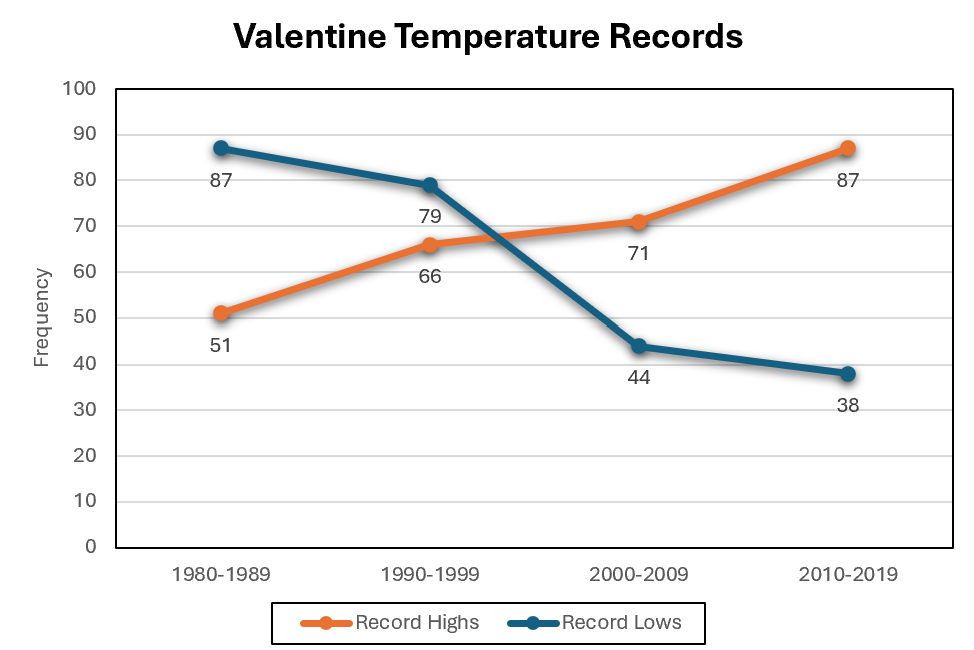
Figure 4: Record temperatures per decade in Valentine, Nebraska. Despite the distance from Omaha, Valentine shows a near identical pattern of increasing record highs and decreasing record lows over the last four decades.
Though these trends are more pronounced to the northwest of Nebraska, the more rural and less agriculturally dense land cover could account for the differences. The urban corridors throughout Lincoln and Omaha would be most likely, though, to exacerbate the extreme heat. Biomass throughout the south and central regions, in contrast, acts as a “lid” on summer air temperature, when drought is not present. Other considerations for these regional differences could include polar vortex variability, which would more readily impact areas in northern Nebraska.
Why is this Important?
These trends reflect a broader trend across many climate indicators. In Nebraska, climate change has led to milder winters with longer dormancy breaks. Summer weather over the last few decades has also been more extreme. Summer climatology now includes historically milder spring months, such as late May and early June.
In Nebraska, these changes will have direct impacts on agriculture and local communities. More extreme, erratic summers will decrease growing days. Corn and soybeans, among a variety of crops grown in Nebraska, will not grow during extreme heat. Conversely, more erratic winters increases dormancy break risks. Ultimately, acknowledging increased heat extremes allows Nebraskans to better prepare for swelling risks.
On the other hand, decreasing cold records primarily represent milder winters across Nebraska. These winters include dormancy breaks that are more frequent and longer, where record high temperatures are commonly set. Breaking the hibernation of plants, including cover crops, is very damaging for agriculture and horticulture across the state.
Further Research
Nebraska's temperature records tell a clear story: record highs are becoming increasingly common while record lows grow rarer across the state. This trend holds true from Scottsbluff to Omaha, suggesting a statewide shift rather than a localized phenomenon. These changes carry significant implications for agriculture, winter weather patterns, and long-term planning. Future analysis could explore seasonal differences within this dataset to determine whether certain times of year are driving these trends more than others. Understanding these patterns will be crucial as Nebraska adapts to a warming climate.
All data utilized was collected from xmACIS2, a service by the Regional Climate Center Program.