Official summer numbers
The meteorological summer of 2025 is in the books and goes down as a warm and wet one for the state of Nebraska. The state average of 12.74" is the wettest since 2019 and only the second summer with above average precipitation so far this decade. The average temperature of 72.7°F was 1.0°F above the 20th century average and is identical to last summer's average temperature. It is also within 1.5°F of every summer in the past decade.
Fewer scorching afternoons
The average maximum temperature (85.0°F) was essentially right at the 20th century average while the average minimum temperature (60.4°F) was 2.0°F above the 20th century average. It was the 11th consecutive summer with minimum temperatures above the 20th century average for the state of Nebraska. Figure 1 shows that the Panhandle was above average for maximum temperatures (like most of the western U.S.) while the rest of the state was near average or slightly below average like most of the north central U.S.
This is a continuation of an ongoing trend where mid-summer temperatures are flat to slightly cooler than the long-term average for much of the Central Flyway while warmer than average temperatures prevail in the western U.S. and northeastern U.S. Most of central and eastern Nebraska had fewer than average days over 95°F and the lowest numbers since at least 2020. The lower maximum temperatures were also a reflection of the higher humidity, increased precipitation, and increased cloud cover. All of these factors were favorable for fungal diseases this summer.
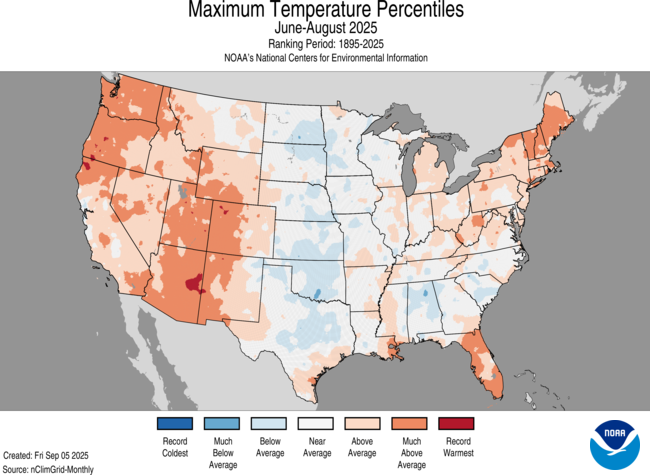
Figure 1. Summer 2025 maximum temperature percentiles
Warm summer nights
John Travolta may have wished the summer nights in 1978 were like this summer because they were warm almost everywhere, including Nebraska. Warmest temperatures relative to long-term averages were found in central and northeast Nebraska. The warm minimum temperatures are also part of an ongoing trend; the last summer Nebraska had cooler than average minimum temperatures was 2014. The U.S. as a whole has not had minimum temperatures below the 20th century average since 2004.
For many decades the brutal summer of 1936 held the title for warmest summer minimum temperatures for the U.S. as a whole. This was broken in the summer of 2002 by a slim margin. It was broken again in 2006. Those two summers now have minimum temperatures that rank 15th and 10th place respectively. This is a trend that is most likely to continue as we see the planet warm.
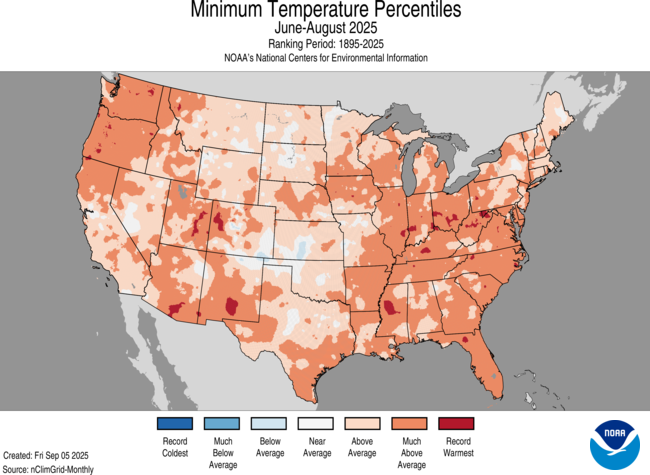
Figure 2. Summer 2025 minimum temperature percentiles
Drought busting summer
It was the wettest summer in several years statewide and was the wettest overall around Albion and Elgin where the summer precipitation was over 20" and not far off the average annual total. Only portions of the northwest Sand Hills had below average precipitation. The increased frequency of precipitation and generous amounts falling from the sky led to significant drought improvement for much of the state. 85 percent of the state was in drought at the beginning of summer (1 June) and less than 20 percent of the state is currently in drought. Most locations saw at least a 1-category improvement in drought conditions (Figure 4) and the area around Elgin went from extreme drought to D-nada over the summer: a 4-category improvement !
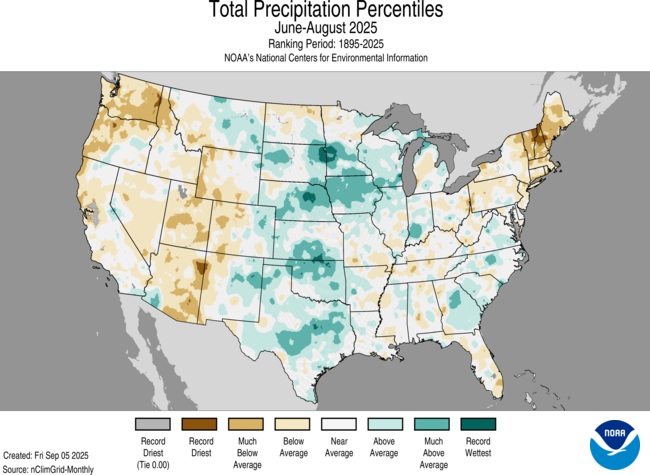
Figure 3. Summer 2025 precipitation percentiles
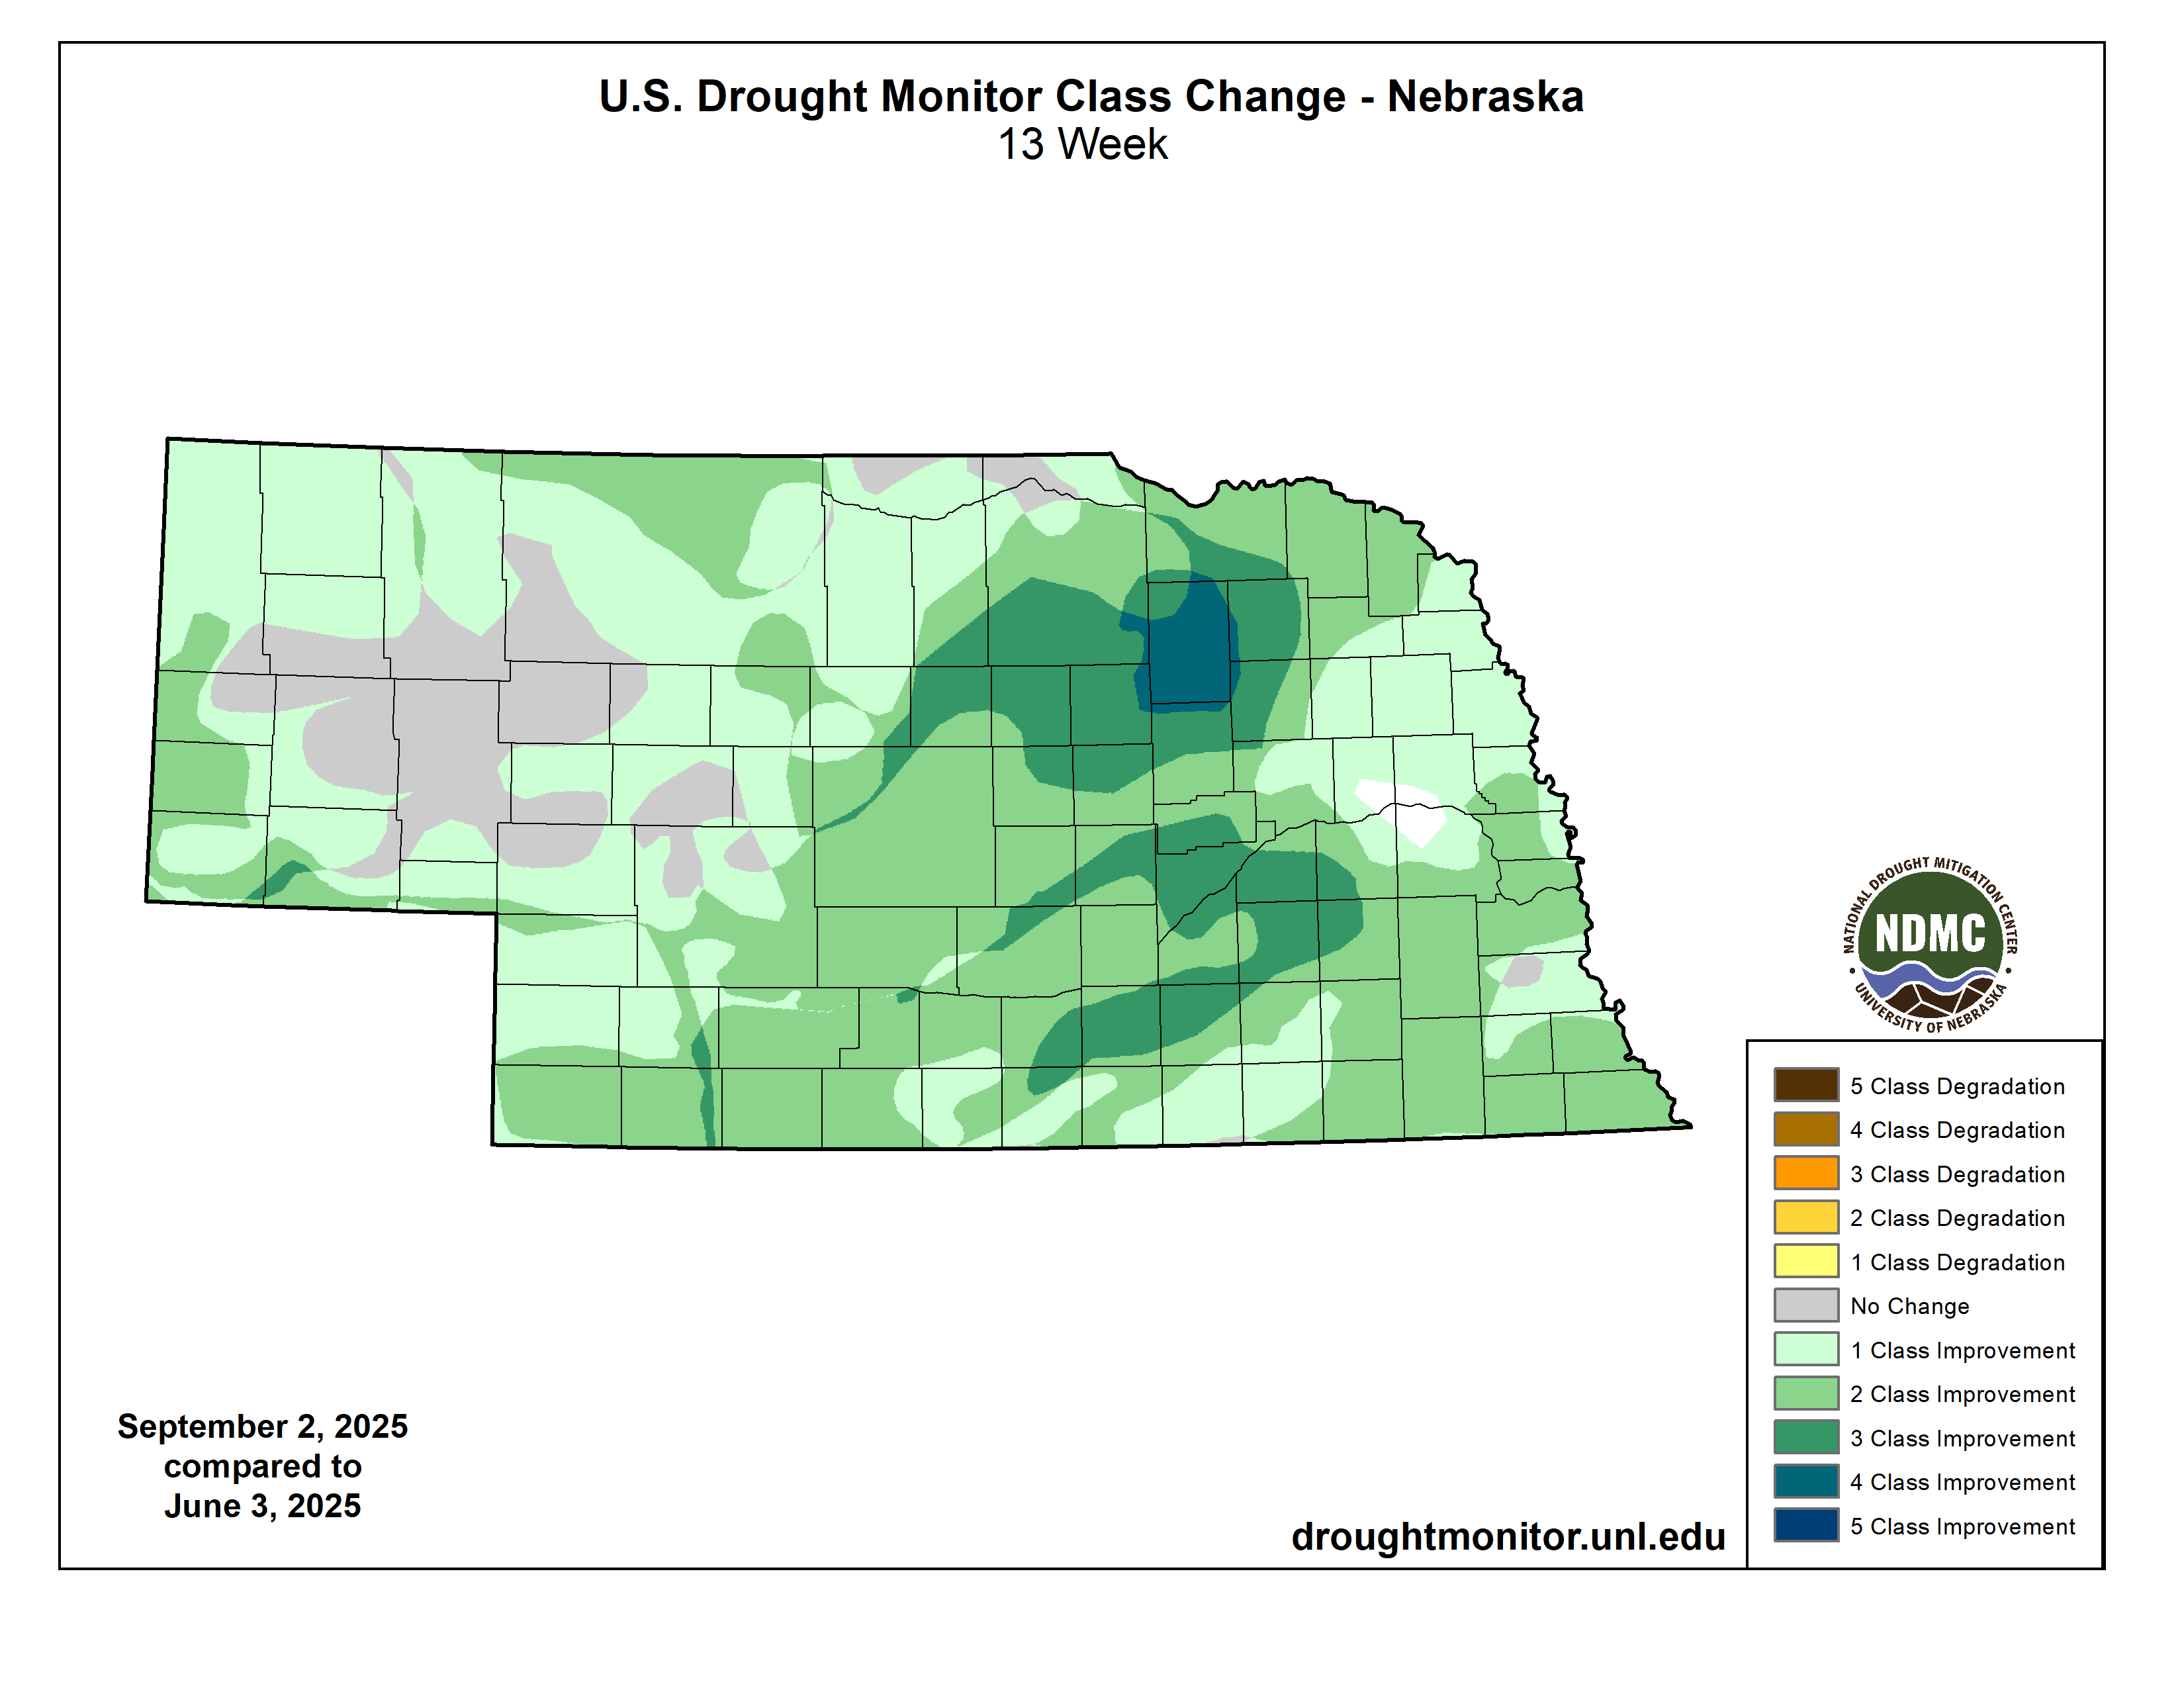
Figure 4. Change in U.S. Drought Monitor categories during the summer
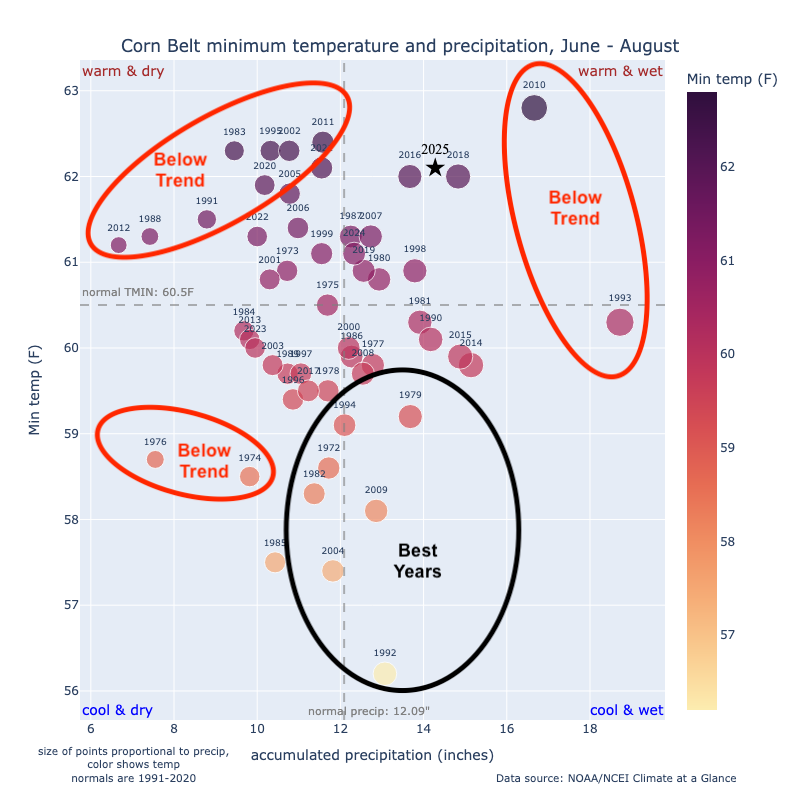
Corn yield thoughts
Figure 5 shows a quad chart of minimum temperatures and precipitation. Like Nebraska, it was a warm/wet one overall with 2016 and 2018 coming in right around this year's combination for the Corn Belt as a whole. Maximum and minimum temperature percentiles this year were very similar to 2016 and 2018 and the anomalies of precipitation are similar. The key difference is this year's precipitation in parts of Illinois and Indiana was below average, likely hurting yields in those areas. 2016 and 2018 were also less humid and likely had fewer disease impacts compared to what 2025 is going to bring. That is not to say we are looking at below-trend yields. But between cloud cover, persistence of humidity, prevalence of disease, and not enough rain in some crucial spots; it is likely that 2025 will deliver numbers that are less above trend than either 2016 or 2018 were.