Overview
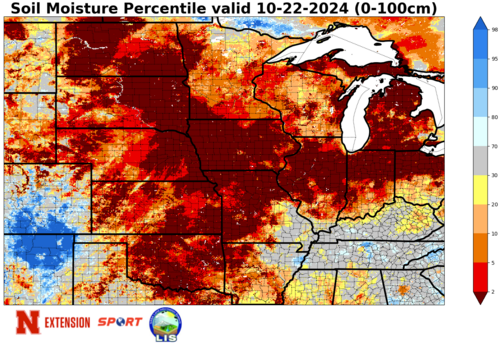
We access weather observations 24/7 and use that data to create useful products that help our stakeholders make informed decisions in their personal and professional lives. Examples include modeled soil moisture products from NASA's SPoRT LIS.
Mesonet
The Nebraska Mesonet is a collection of 63 high quality, standardized weather and soil observation stations located throughout Nebraska. The term “mesonet” is derived from the field of meteorology, where “mesoscale” atmospheric features occur on scales of 10 – 100 km (6 – 60 miles). These include thunderstorms, lake breezes, topographical influences on weather, and similar atmospheric phenomena. In Nebraska, thunderstorms are the most common example. A mesonet is designed to capture these weather phenomena, ideally leading to a dense station network covering the entire state. The Mesonet was started in 1981.
Products
Climate Trends
Our climate observation data feeds into regional and national data sets, which date back to 1895. Using that history of data we can determine what the climate of the future might look like under a variety of scenarios for the different regions of Nebraska. The predicted changes aren't uniform across the state.
View Climographs
Request Data
Our data is useful to a variety of stakeholders, including weather professionals, natural resource researchers, lawyers and media professionals, and sometimes they require more in-depth information than we provide directly on our site. We respond to requests for more detailed data in order by request and as quickly as possible.
Request Data
Climate Resources
Climate Normals
Climate Normals are three-decade averages of climatological variables, such as temperature and precipitation.
Freeze/Frost Stats
What are the statistical odds it will frost or freeze in Nebraska by date in the spring or fall. Find out here.
Climate Updates
Find our weekly looks ahead at what weather is coming and how it will affect Nebraska. Watch or listen here.
Historical Trends
Have our temperatures been warmer or cooler than average? Have we had more or less rain? Historical trends show us.