
Heavy rain
Remnants from Hurricane Polo have been having an impact on the eastern 2/3 of the state since late Monday when precipitation first entered western and north central Nebraska. But the heaviest was saved for last night when the surface low associated with Polo moved into the region and interacted with a stalled out boundary that was roughly along the Platte River. The sounding from Omaha yesterday evening showed an atmosphere that was saturated to the tropopause and over 2" of precipitable water (over 2").
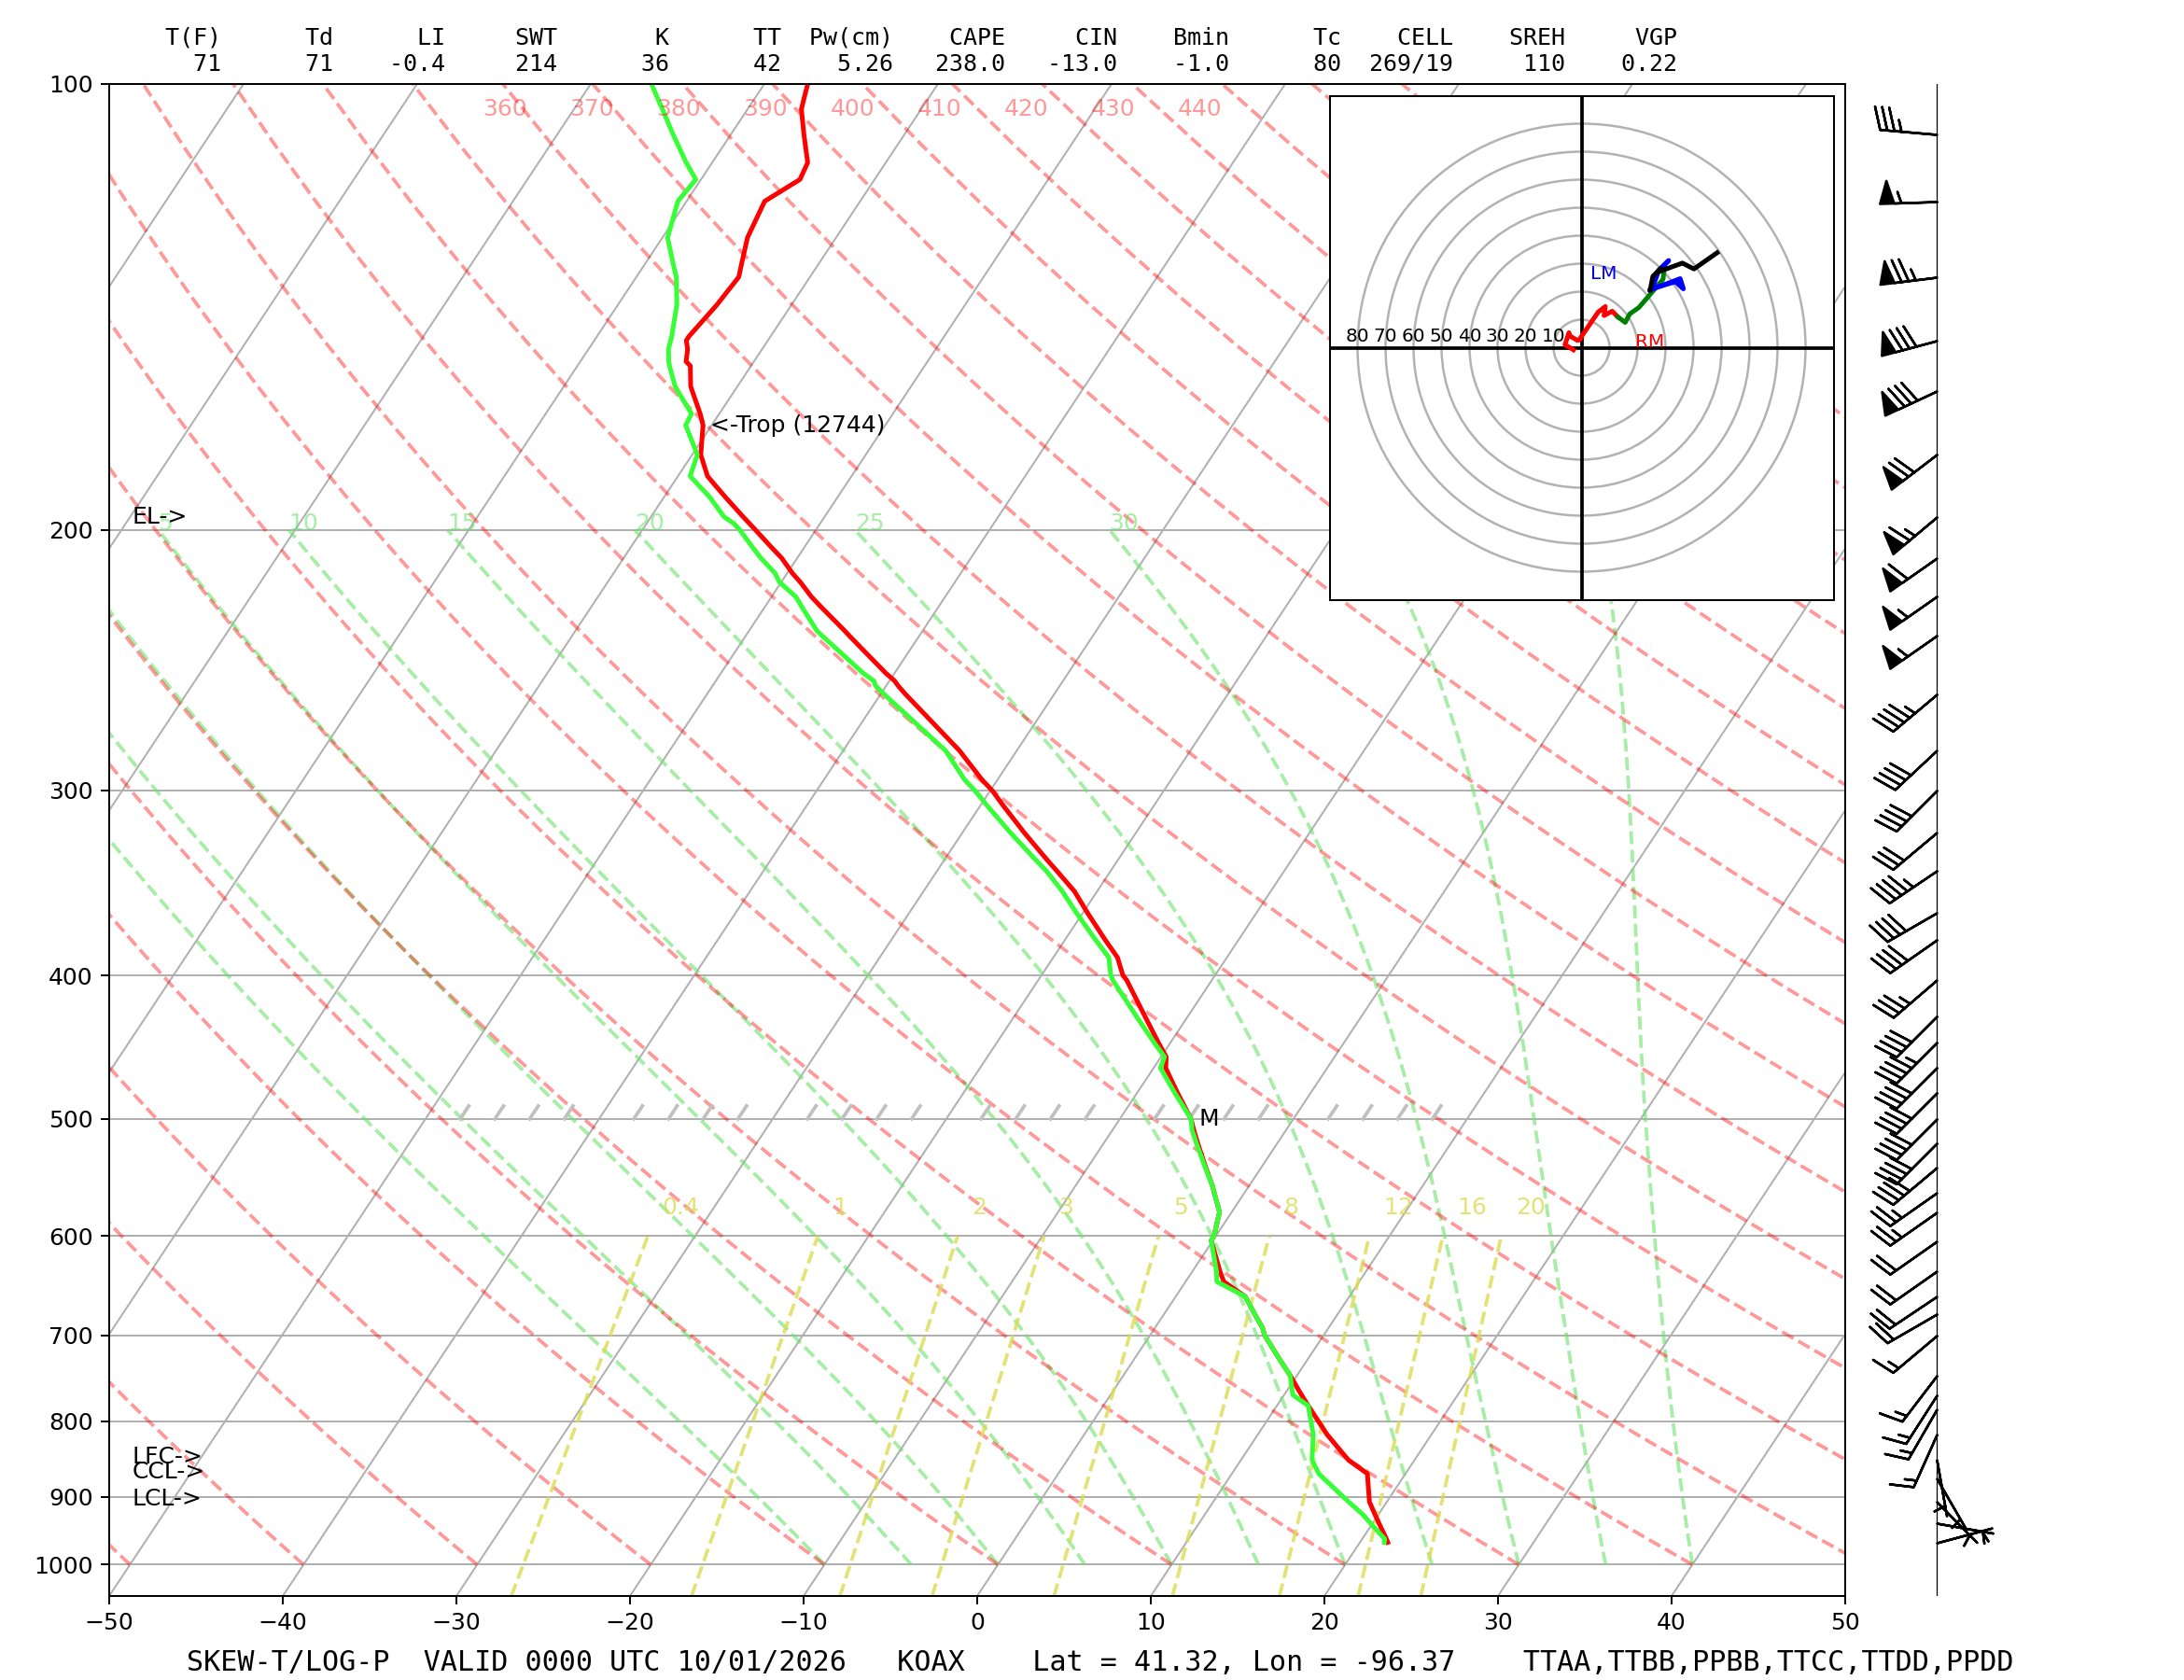
Figure 1. Omaha's sounding from 7 PM yesterday evening.
In other words, there was plenty of tropical moisture in our area to squeeze out and the frontal boundary helped provide enhanced rising motion for very heavy rain. Areas along and south of the boundary got hammered with heavy rain and in some cases, record daily rainfall totals.
Yesterday's official total of 6.15" at the Lincoln airport was not only a new monthly record. It is now the wettest calendar day in Lincoln's history. Omaha Eppley had 4.74", good for the 9th wettest day on record. The record of 6.46" was set back in August 1999 and over 5" fell at the Omaha airport on September 23, 2015. Grand Island (1.73"), Hastings (2.03"), McCook (1.54"), and Falls City (3.27") all are long-term sites that set daily records of precipitation yesterday.
But in general, the last few days have delivered significant precipitation to much of southern and eastern Nebraska. 72-hour precipitation totals over 2" are common in south central and eastern Nebraska. There's also a relatively wide area of 4" plus from Hebron northeast to Omaha and into western Iowa. Heaviest totals were found from the northwest part of Lancaster County into western Douglas counties where over 6" was common. Maximum appears to be in northwest Sarpy County where a CoCoRaHS observer reported 7.32".
Record wet month
Earlier in the week I wrote about all of the record warm average minimum temperatures for September being set across the state. Those will all verify. However, after the heavy rains yesterday, this past month has moved into record territory for some sites in eastern Nebraska. It was the fourth wettest September on record in Falls City (10.23"), second wettest in Omaha (11.92"), and the wettest on record in Lincoln (11.49"). It was the most rain in a calendar month in Lincoln since July 1993 and for Omaha it was the most rain in a calendar month since August 1999. Note that some locations in west Omaha had almost 16" for the month, which would be the wettest month on record in Omaha.
| Station | Avg Max Temp | Avg Min Temp | Avg Temp | Max Temp | Min Temp | GDD base 50 | HDD base 65 | CDD base 65 | Days Max > 90F | Days Min > 70F | Days Max < 32F | Days Min < 0F | Total Precip |
| ALLIANCE MUNICIPAL AIRPORT ASOS | 78.8 | 53.0 | 65.9 | 96 | 43 | 476 | 64 | 90 | 4 | 0 | 0 | 0 | 2.73 |
| BROKEN BOW MUNICIPAL AP | 77.3 | 58.6 | 67.9 | 96 | 49 | 538 | 44 | 132 | 2 | 0 | 0 | 0 | 1.92 |
| CHADRON MUNICIPAL AP | 82.3 | 53.4 | 67.8 | 100 | 40 | 536 | 42 | 128 | 7 | 0 | 0 | 0 | 2.48 |
| COLUMBUS | 78.4 | 63.4 | 70.9 | 95 | 54 | 586 | 30 | 196 | 7 | 4 | 0 | 0 | 4.86 |
| FALLS CITY BRENNER FIELD | 84.7 | 64.4 | 74.6 | 100 | 56 | 737 | 3 | 290 | 11 | 9 | 0 | 0 | 10.23 |
| GRAND ISLAND CENTRAL NE REGIONAL AP | 80.1 | 62.9 | 71.5 | 99 | 53 | 644 | 24 | 218 | 9 | 6 | 0 | 0 | 5.72 |
| HASTINGS MUNICIPAL AIRPORT | 80.5 | 63.6 | 72.0 | 98 | 55 | 661 | 17 | 228 | 8 | 7 | 0 | 0 | 6.76 |
| HOLDREGE BREWSTER FIELD AP | 83.5 | 63.5 | 73.5 | 99 | 56 | 610 | 11 | 231 | 10 | 1 | 0 | 0 | N/A |
| IMPERIAL MUNICIPAL AP | 83.9 | 58.4 | 71.2 | 98 | 50 | 636 | 16 | 202 | 11 | 0 | 0 | 0 | 1.13 |
| LINCOLN AIRPORT | 82.3 | 64.8 | 73.6 | 101 | 55 | 706 | 10 | 267 | 9 | 9 | 0 | 0 | 11.49 |
| MCCOOK MUNICIPAL AP | 82.0 | 61.8 | 71.9 | 100 | 55 | 657 | 11 | 218 | 10 | 1 | 0 | 0 | 5.32 |
| NORFOLK KARL STEFAN MEMORIAL AP | 77.4 | 61.7 | 69.6 | 96 | 51 | 586 | 36 | 172 | 7 | 1 | 0 | 0 | 3.56 |
| NORTH PLATTE REGIONAL AP | 80.3 | 58.4 | 69.4 | 96 | 51 | 581 | 30 | 160 | 7 | 0 | 0 | 0 | 2.34 |
| OMAHA EPPLEY AIRFIELD | 81.0 | 64.8 | 72.9 | 98 | 57 | 687 | 16 | 254 | 9 | 8 | 0 | 0 | 11.92 |
| ORD EVELYN SHARP FIELD | 77.5 | 60.4 | 68.9 | 96 | 49 | 568 | 36 | 154 | 2 | 0 | 0 | 0 | 2.48 |
| SCOTTSBLUFF W B HEILIG FIELD AP | 83.0 | 53.8 | 68.4 | 98 | 44 | 553 | 24 | 127 | 7 | 0 | 0 | 0 | 0.85 |
| SIDNEY MUNICIPAL AP | 81.9 | 55.7 | 68.8 | 96 | 47 | 564 | 32 | 146 | 5 | 0 | 0 | 0 | 2.11 |
| TEKAMAH MUNICIPAL AP | 77.8 | 61.8 | 69.8 | 94 | 52 | 594 | 31 | 176 | 5 | 3 | 0 | 0 | 6.45 |
| VALENTINE MILLER FIELD AP | 79.2 | 56.7 | 67.9 | 97 | 47 | 538 | 59 | 147 | 5 | 1 | 0 | 0 | 2.87 |
Table 1. September 2026 summary. Bold value indicates new monthly precipitation record and italics indicate a top 5 wet month.


