Summary
The official numbers from NCEI have not been released with the shutdown. This page will be updated with those official numbers once they are released. IEM analysis suggests that September 2025 was the 23rd wettest September on record in Nebraska with an average of 2.98". Big improvement over last year when September was the driest on record. Temperatures averaged 65.9°F, above the 20th century average (41st warmest) but coolest since 2020.
To start things off, we experienced cool conditions across much of Nebraska, especially in the first week, with some record cool morning lows in the Panhandle, and then shifted to a warm, ridge-dominated pattern into the mid-month period that produced close to several days in the 80s–90s across central and eastern counties of Nebraska, such as the Lincoln/Omaha area, which saw repeated upper-70s to mid-90s. Humidity was generally low to moderate during the ridge episodes this past month, with brief increases during convective events and frontal passages; precipitation was spotty with isolated convective activity towards the middle parts of the month, particularly the 14th, 16th, producing locally heavy winds and hail. More will be discussed below regarding what we experienced this past September.


Upper air pattern analysis
The 500-mb analyses during September showed troughing over the western U.S. early in the month, which gave us that initial cool spell, then a central-Plains ridge building in around mid-September that suppressed large-scale ascent and favored warmer, drier conditions across Nebraska. The 850-mb layer generally supported warm air advection during the ridge episodes, with southerly flow ahead of the ridge axis, and brief low-level moisture returned, which coincided with the shortwave troughs and frontal passages that produced the convective rainfall events seen on the 14th and 16th.
The cold front and associated shortwave moved through early in the month, contributing to the cool start to the month with strong radiational cooling in the Panhandle. During the early to middle parts of the month, surface analyses were frequently dominated by a building ridge over the central Plains, interrupted by fast-moving Pacific shortwaves that produced frontal passages and scattered thunderstorms, with these frontal passages being the primary mechanism for the heavier, but localized, rainfall events.
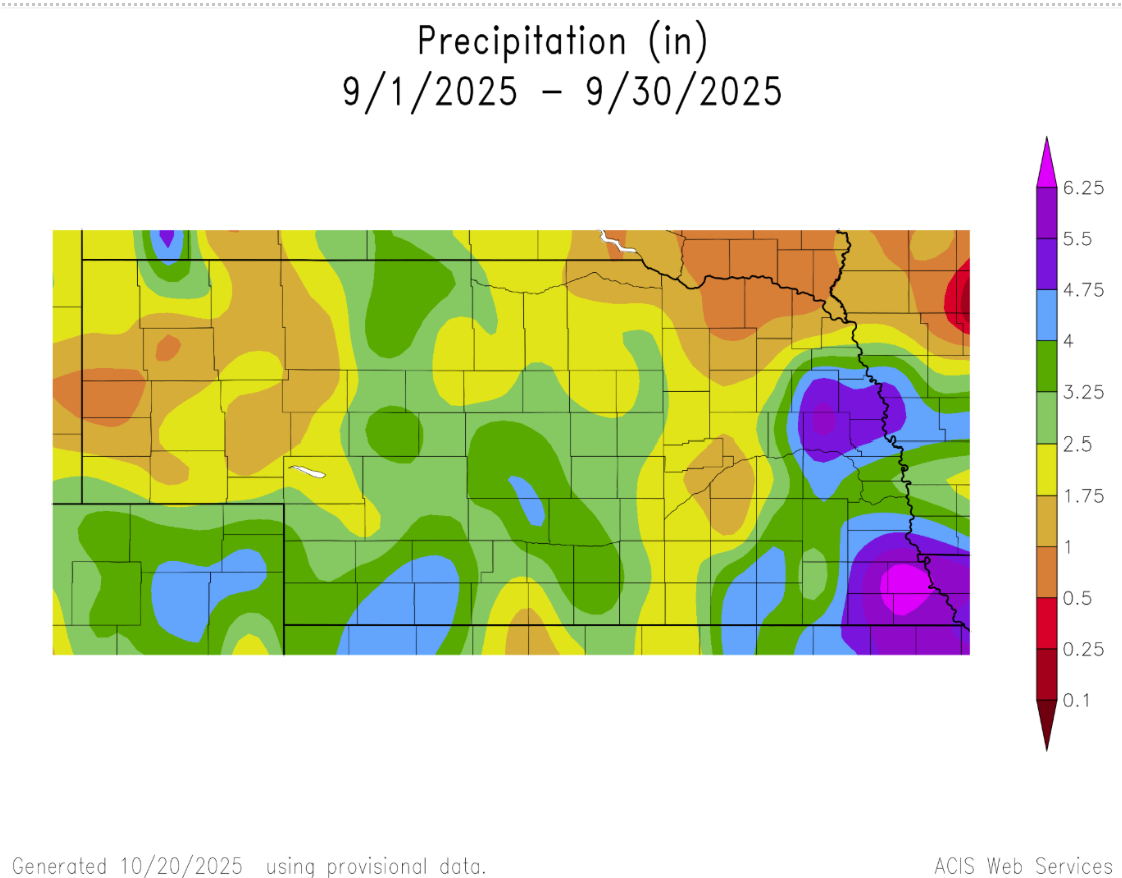
Precipitation
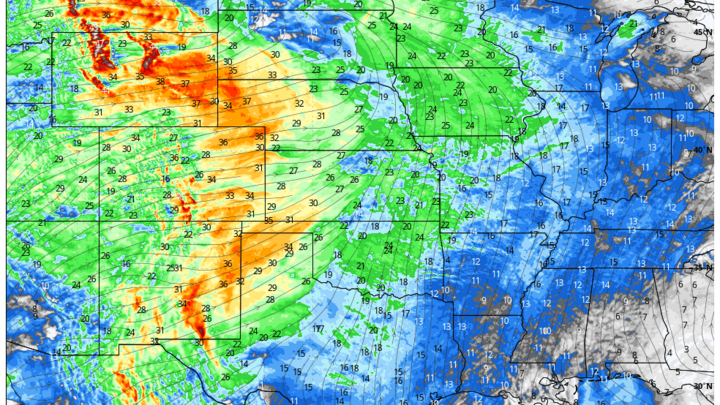
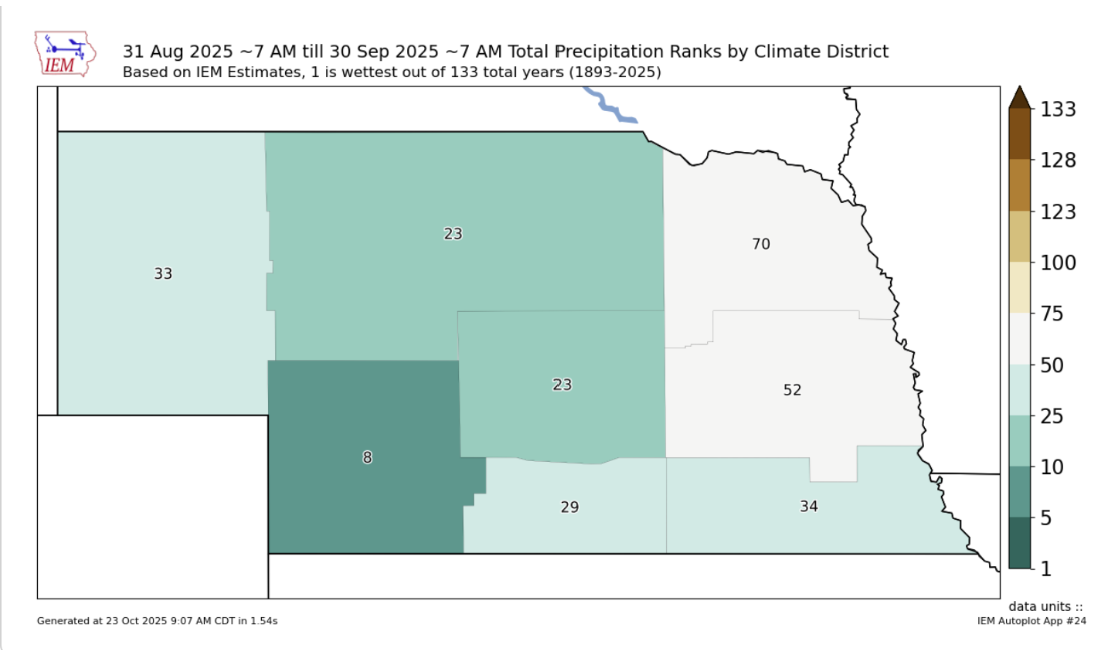
Precipitation across Nebraska in September was highly variable by location. Precipitation totals in some southern/southeastern spots was significant while much of northeast Nebraska was pretty dry. particularly where the ridge dominated, of relatively dry conditions, which enabled more convective activity to occur. Below, I was able to create a graphic showcasing these precipitation patterns over the state of Nebraska using the Iowa Environmental Mesonet (IEM) website. However, something I would like to note was the higher values of rainfall seen in the southwest portion of Nebraska, which aligned well with the convective activity seen from the SPC reports from the 16th. Using the ACIS website, we can better see where these precipitation amounts had the most impact on the state. It helps to showcase where the variable rainfall events occurred in southwest Nebraska, as well as the more concentrated rainfall periods seen in the eastern to southeastern portion of the state.
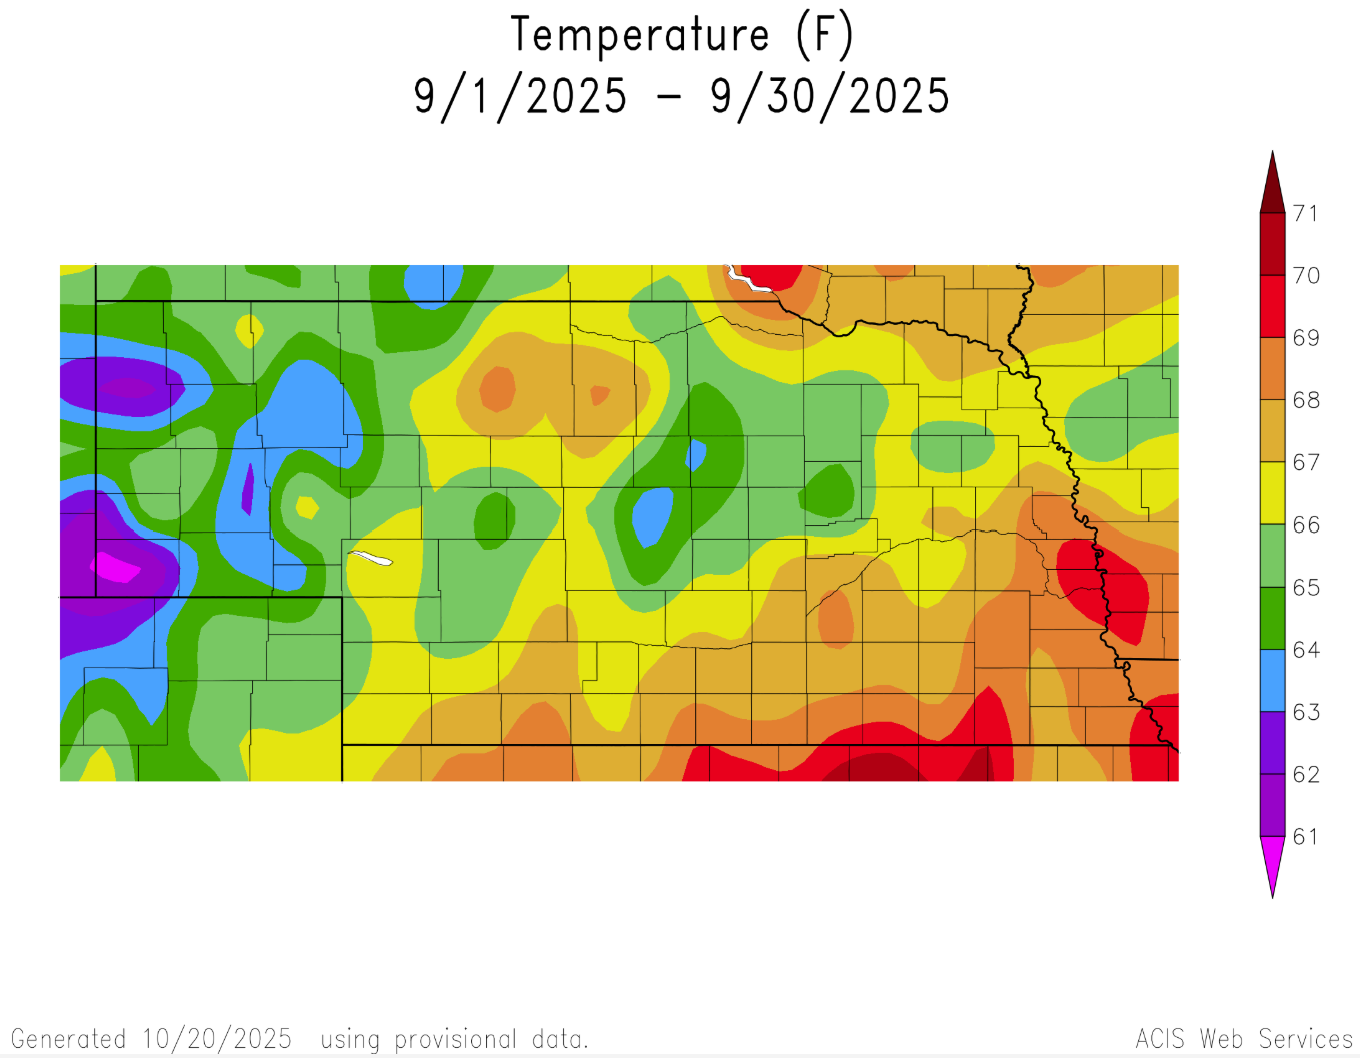
Temperature
Some notable extremes from this past month included very warm maximum temperatures in the mid-90s at scattered central and eastern locations during the period of ridging we experienced throughout the mid to latter half of the month. For example McCook Nebraska, in the southwest portion of the state hit 101°F. The coldest lows occurred in the Panhandle early in the month during our early season cold streak with temperatures as cold as the upper 20's around Alliance and Harrison. This ACIS diagram depicts these temperatures mentioned for the average temperatures of the past month, which aligns well with the highs and lows experienced in the state during the past month.