
Day by Day
Given the prior week’s nonstop severe weather, this week (July 5-11) was significantly calmer. Sunday, July 5th, was the perfect way to end the Independence Day Weekend for most of the state. A ridging pattern moving from the Rockies settled over western Nebraska, resulting in a high maximum temperature of 100°F in Chadron. Areas surrounding far northwest Nebraska experienced similar conditions. Overall, the state had a relatively cloudless day, except for some isolated showers.
Looking into Monday, a weak frontal boundary moved into northwest Nebraska, resulting in severe weather. There were reports of 66-mph winds in Scotts Bluff County and medium- to large-sized tree limbs broken in Sheridan County.
Tuesday was a relatively calm day with little cloud cover over most of the state, allowing temperatures to reach 101°F in Scotts Bluff and Chadron. The ridging pattern over the four-corner region would slowly weaken because of new disturbances that were moving in from the central/northern Pacific coast, allowing southerly winds to draw up moisture from the Gulf of Mexico into Nebraska.
Throughout Wednesday, a slow and weak surface low located in eastern South Dakota would eventually pick up speed and move eastward in the afternoon, dragging a northeast-southwest-oriented cold front across Nebraska in the evening. Ahead of the cold front, ample instability for thunderstorm development with little to no convective inhibition was present. This environment combined with the forcing provided by the cold front initiated thunderstorms in the evening, with portions of those thunderstorms becoming severe, with the main threat being damaging wind gusts. The Aurora Airport received 74 mph wind gusts, and 2-inch hail fell 5 miles west-southwest of Fullerton.
Overnight, thunderstorms in western Nebraska, a few of which were severe, would move east and weaken. Before the last thunderstorm dissipated, it went through the Hebron area, which already received heavy rain the previous day. After the thunderstorm passed, a citizen in Hubbell reported they had received 3.7 inches of rain. Similar to Wednesday, high-based thunderstorms would form over western Nebraska in the afternoon from a cold front. Wind gusts of 60 mph were observed 11 miles northwest of Max, which ripped off the roof of a machine shed just a few miles south and experienced golf ball-sized (1.75-inch) hail. Just two miles north of Hemingford, 3.64 inches of rain were recorded as well as roads covered by water.
Friday and Saturday would be relatively calm for severe weather due to the zonal flow over the region. It wouldn’t last long because an upper-level ridge would start to build from the west over the weekend.
Weekly Statistics and Figures
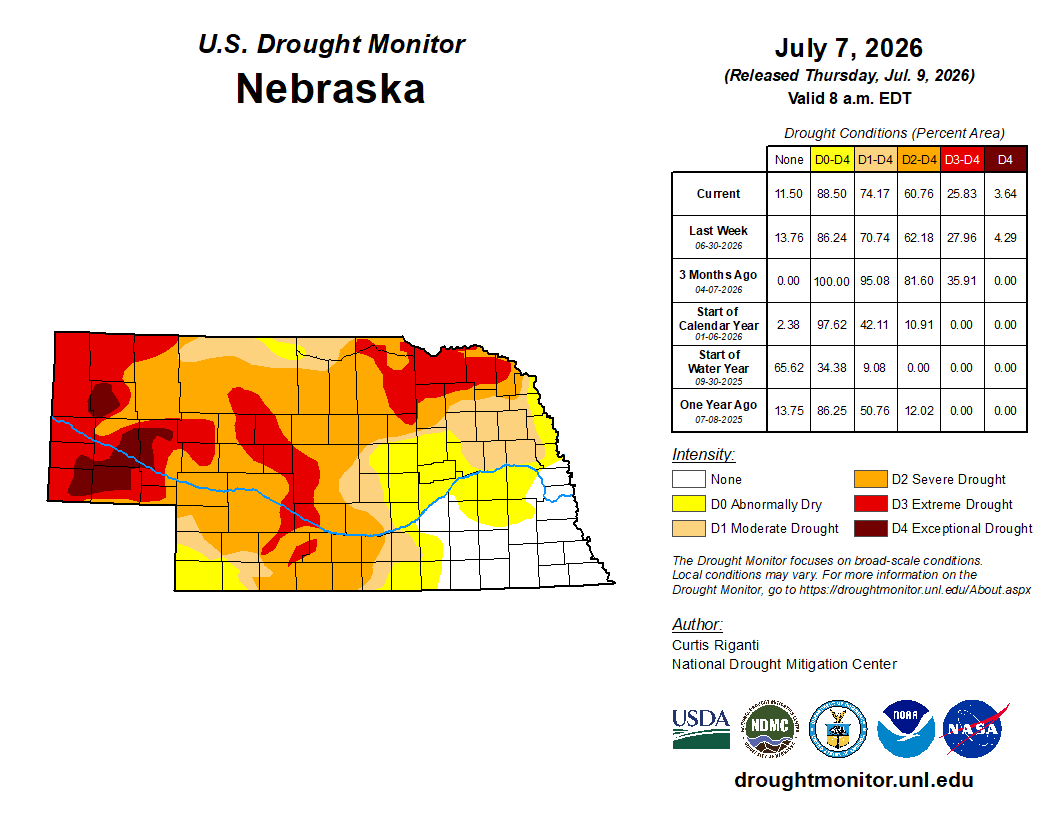
Figure 1. Current Nebraska drought map.
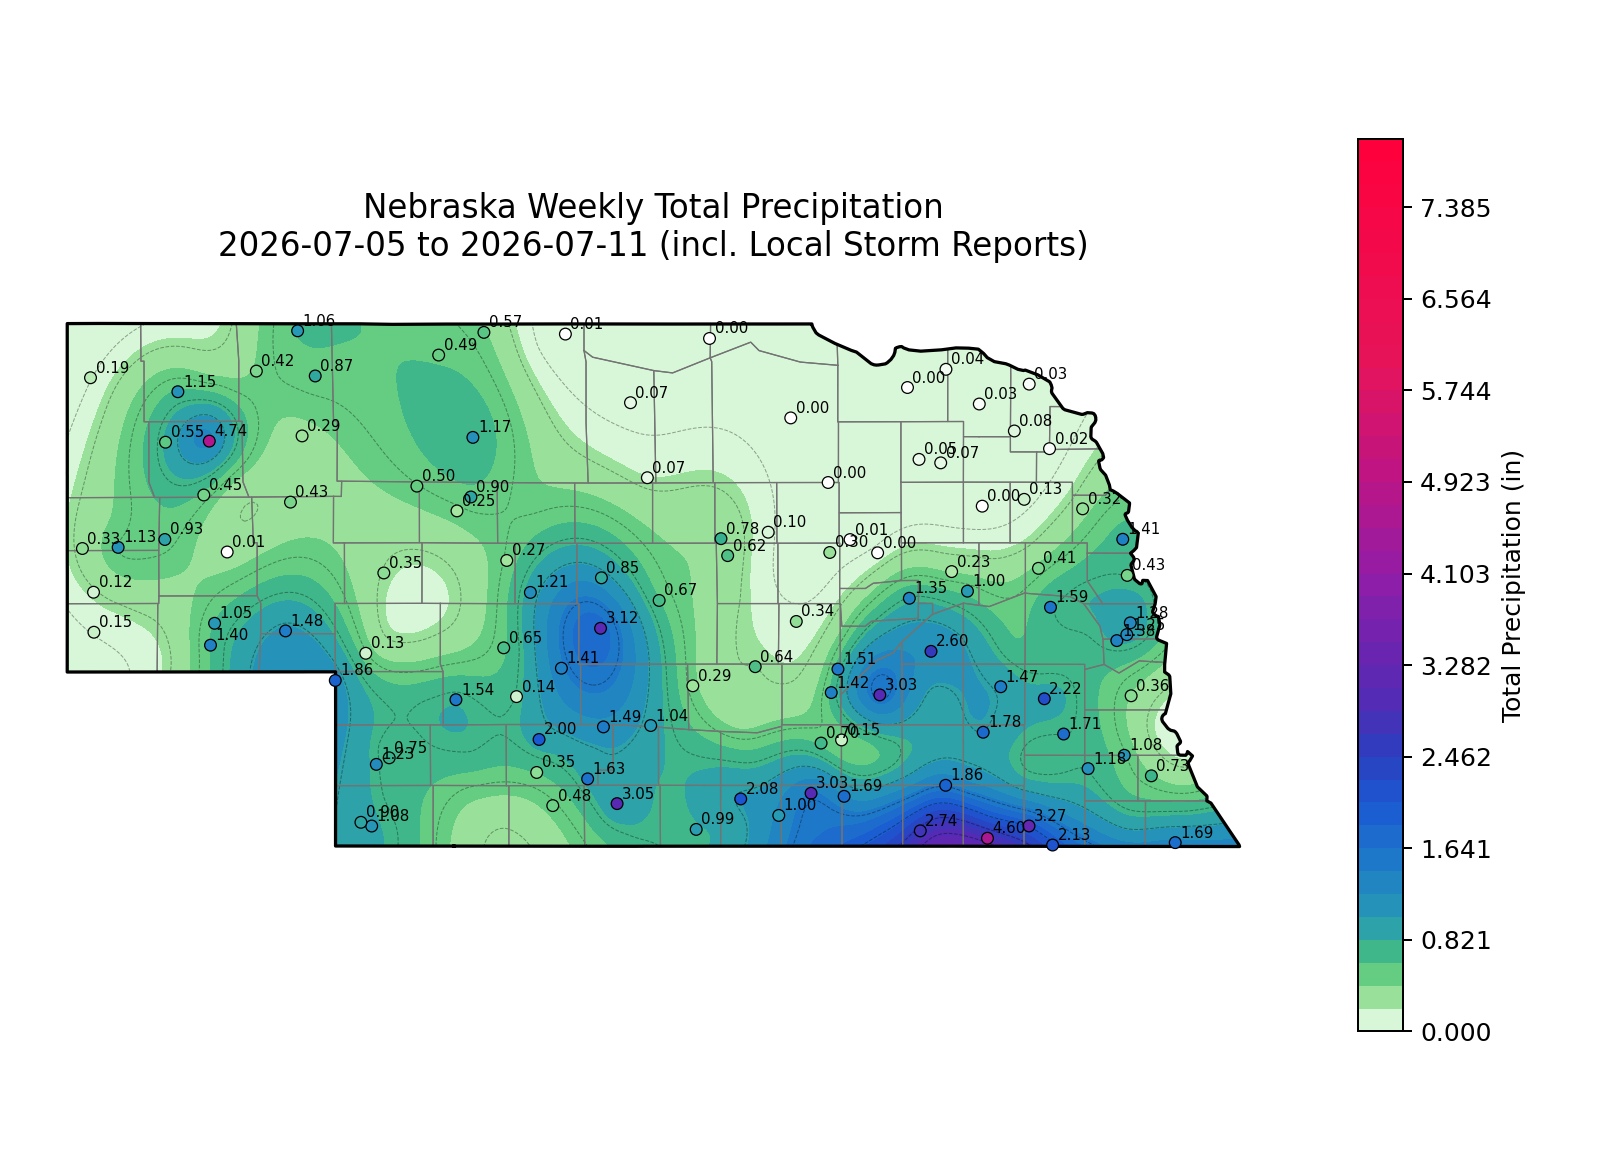
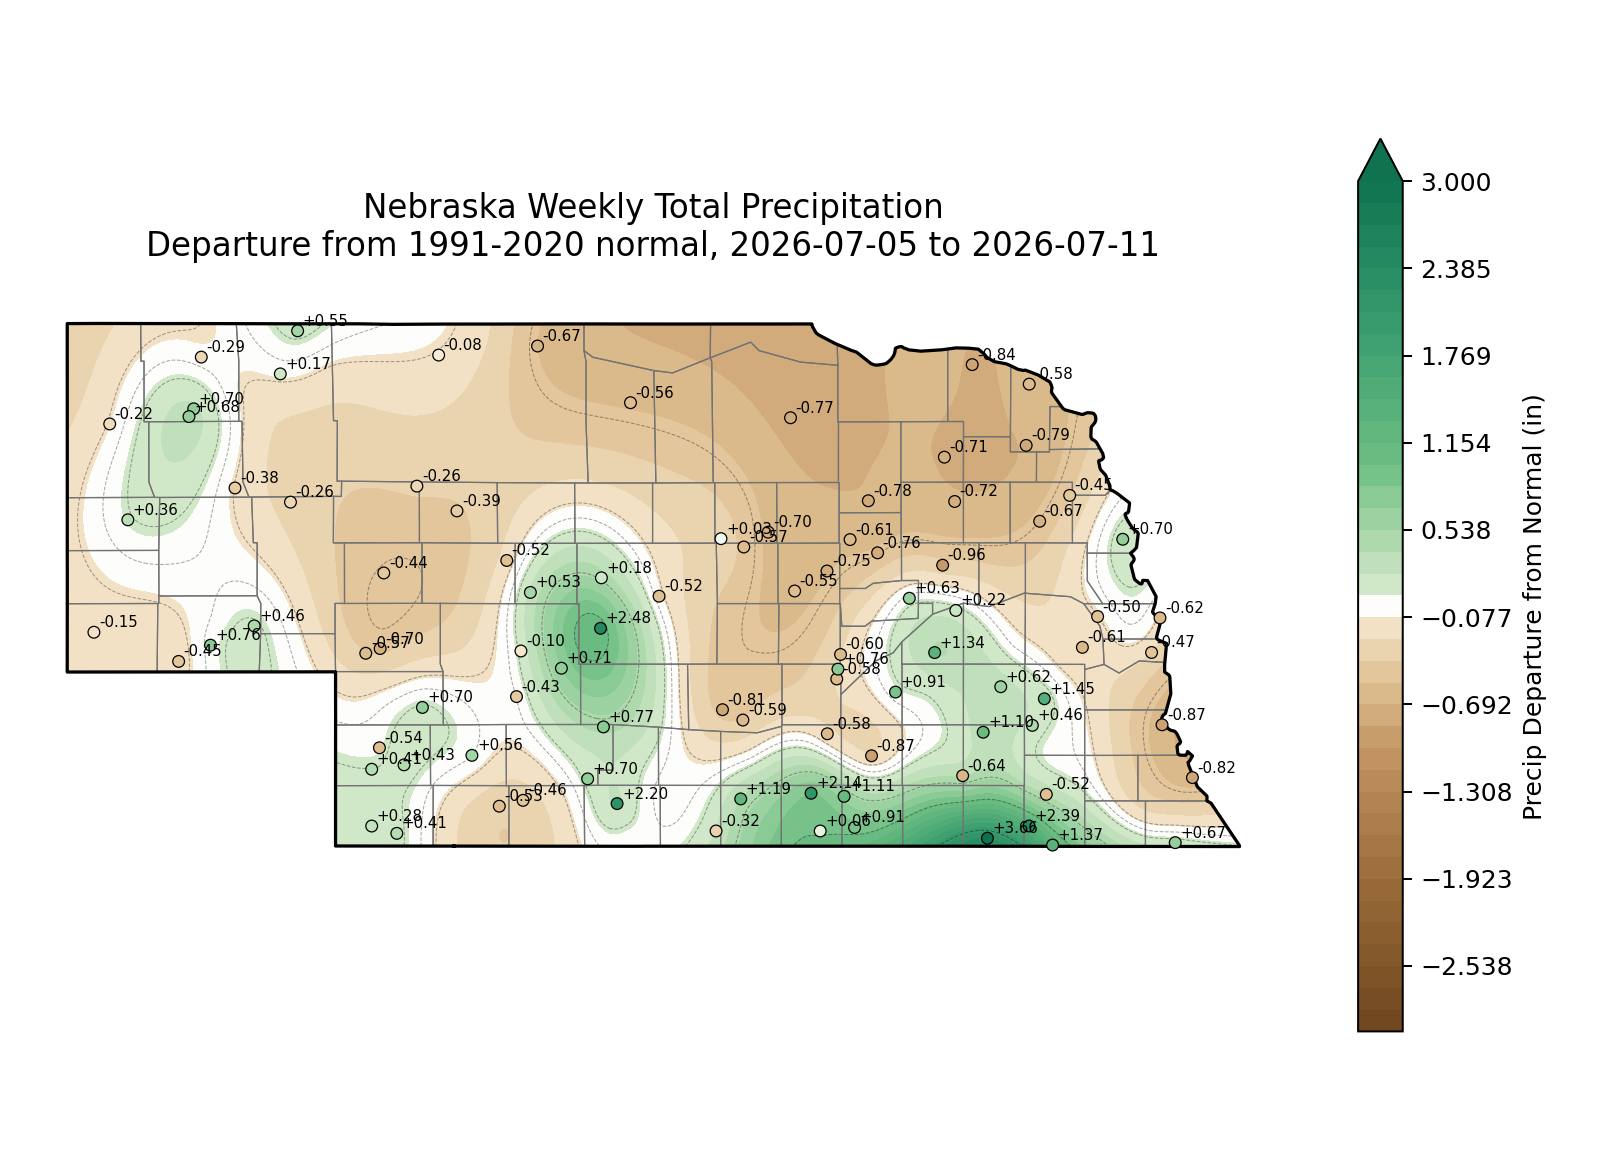
This week continued this year's trend where northern Nebraska received less rain than usual while the southern portions received above-normal precipitation. This will most likely worsen the drought in the northern portion of the state and could see it upgraded to a D4 tomorrow when the new map comes out. We could also see some of Box Butte County and central Nebraska having a class improvement.
Maximum Temperature
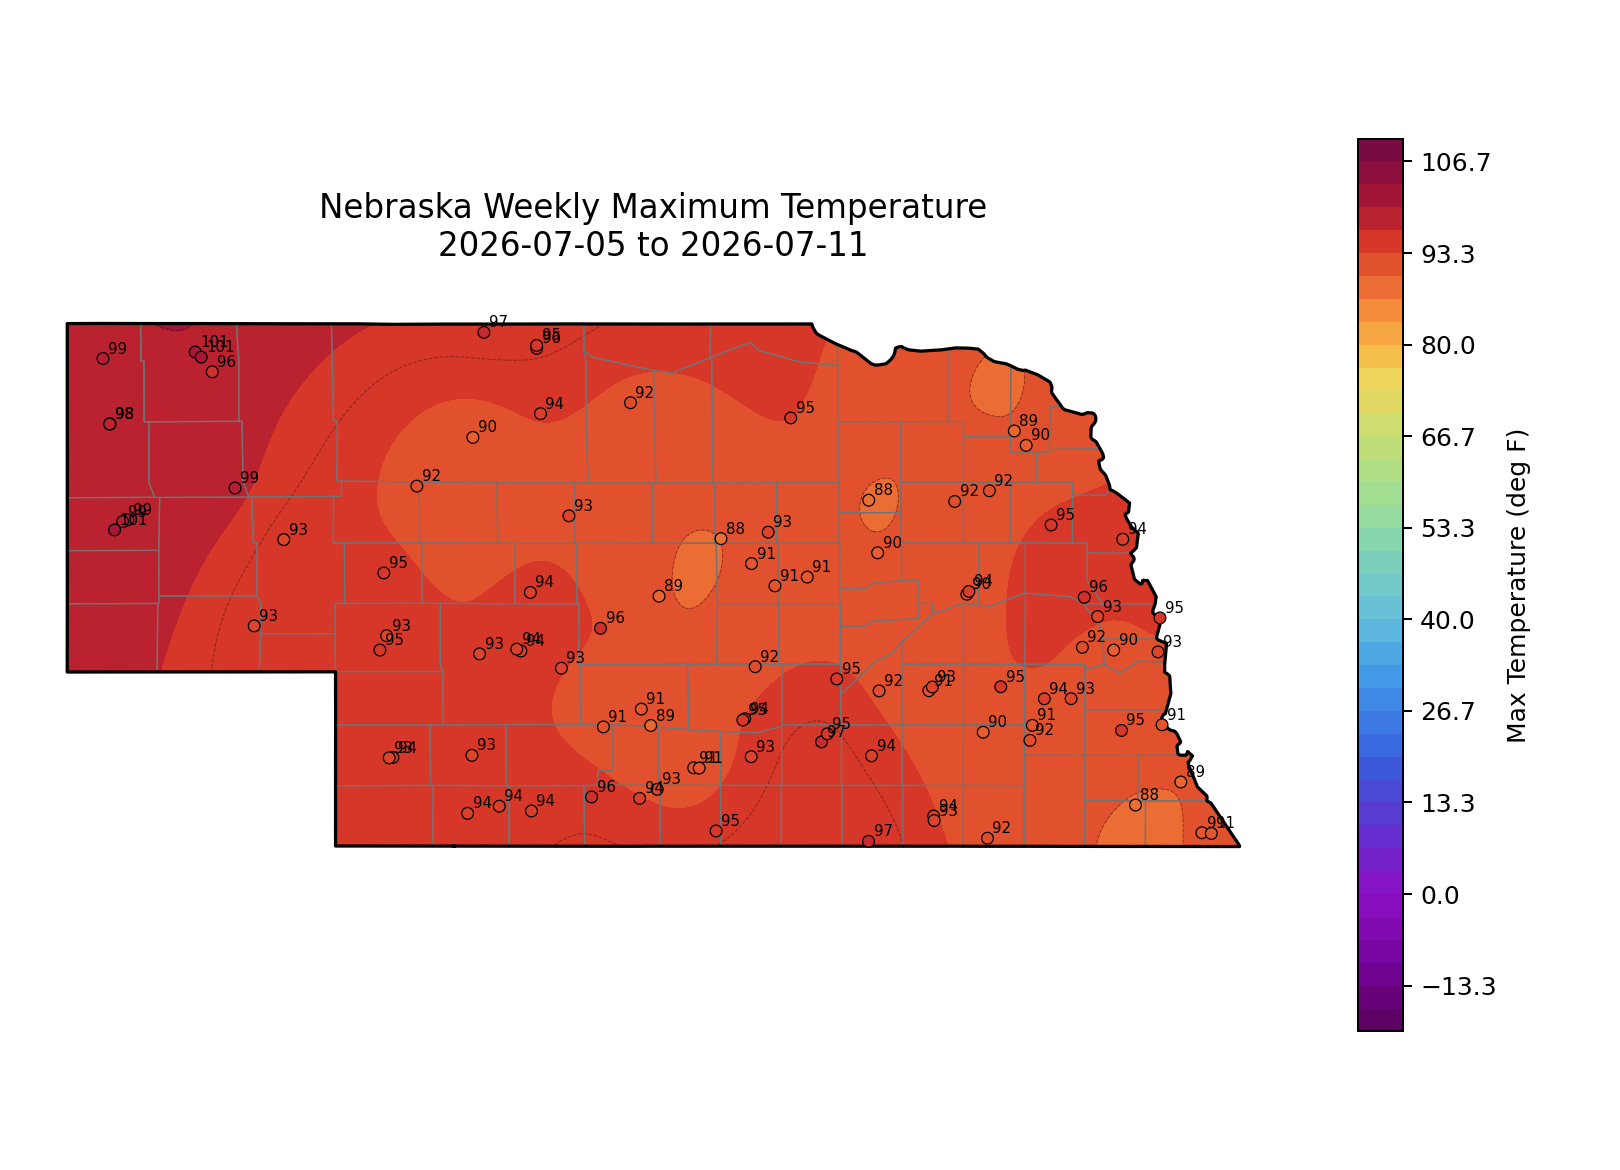
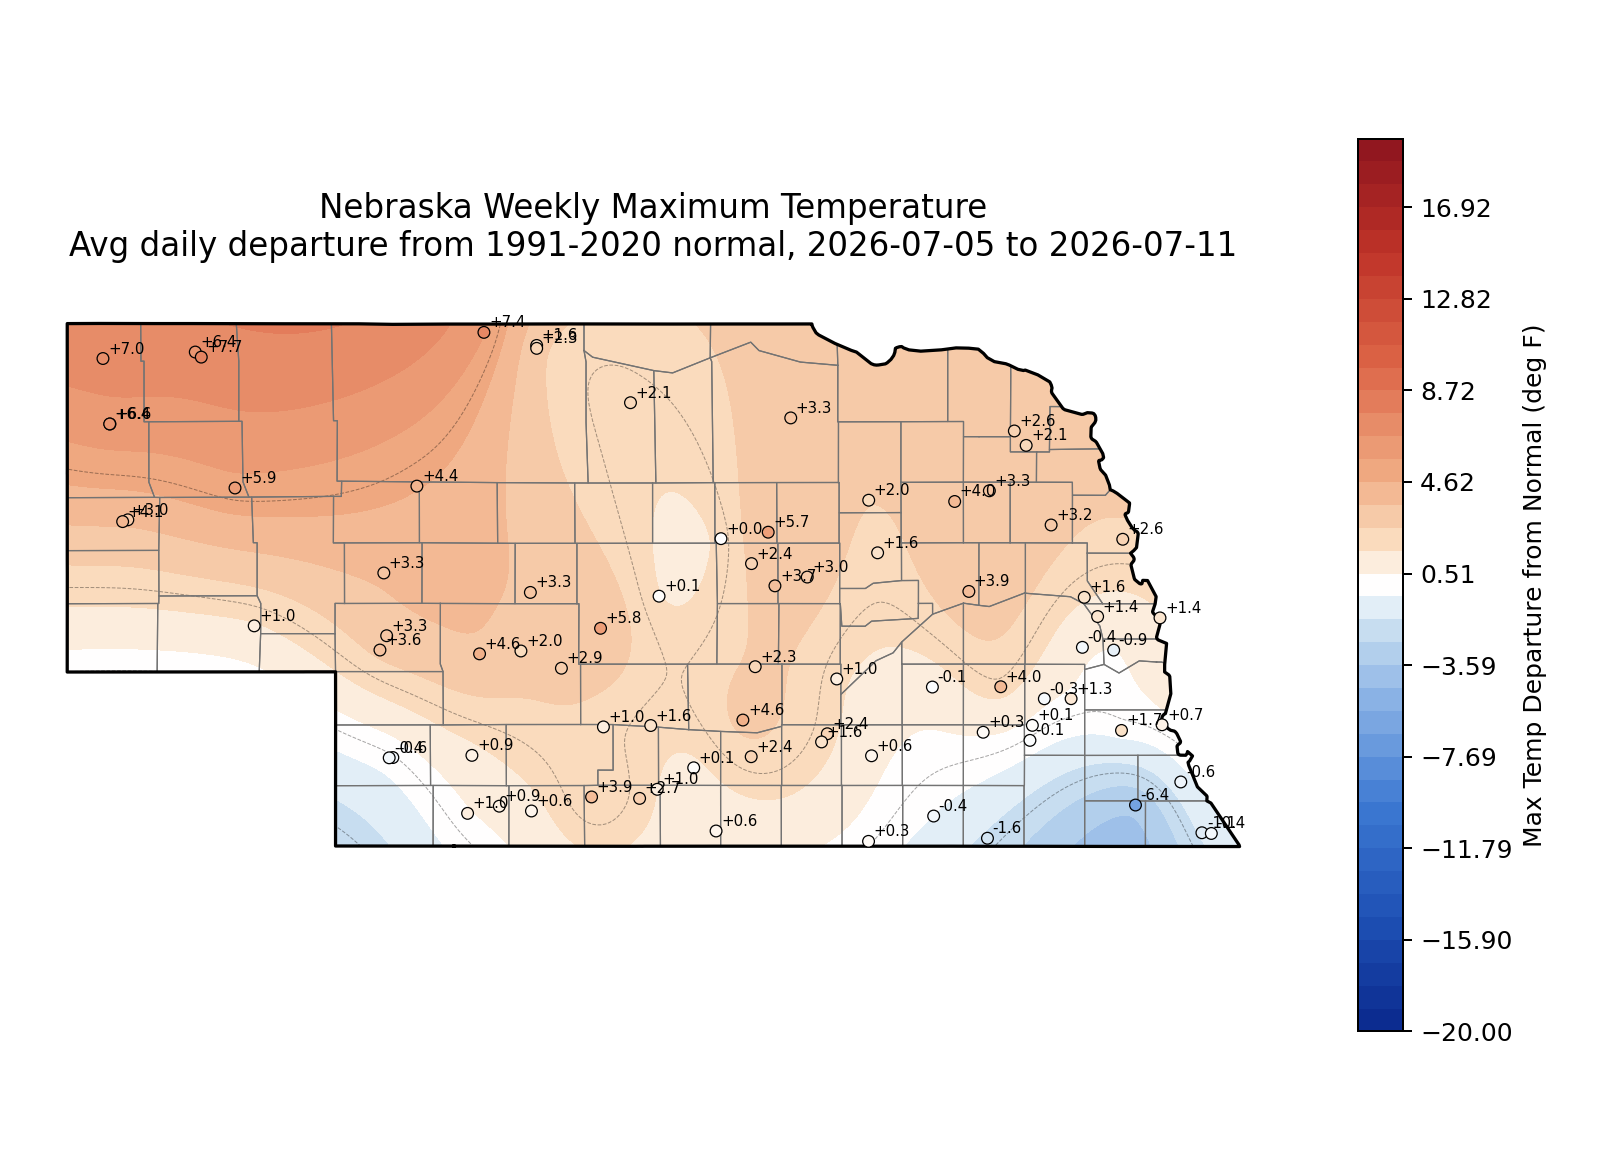
The highest temperature we saw was 101°F in Chardon on Tuesday, Wednesday, and Saturday.
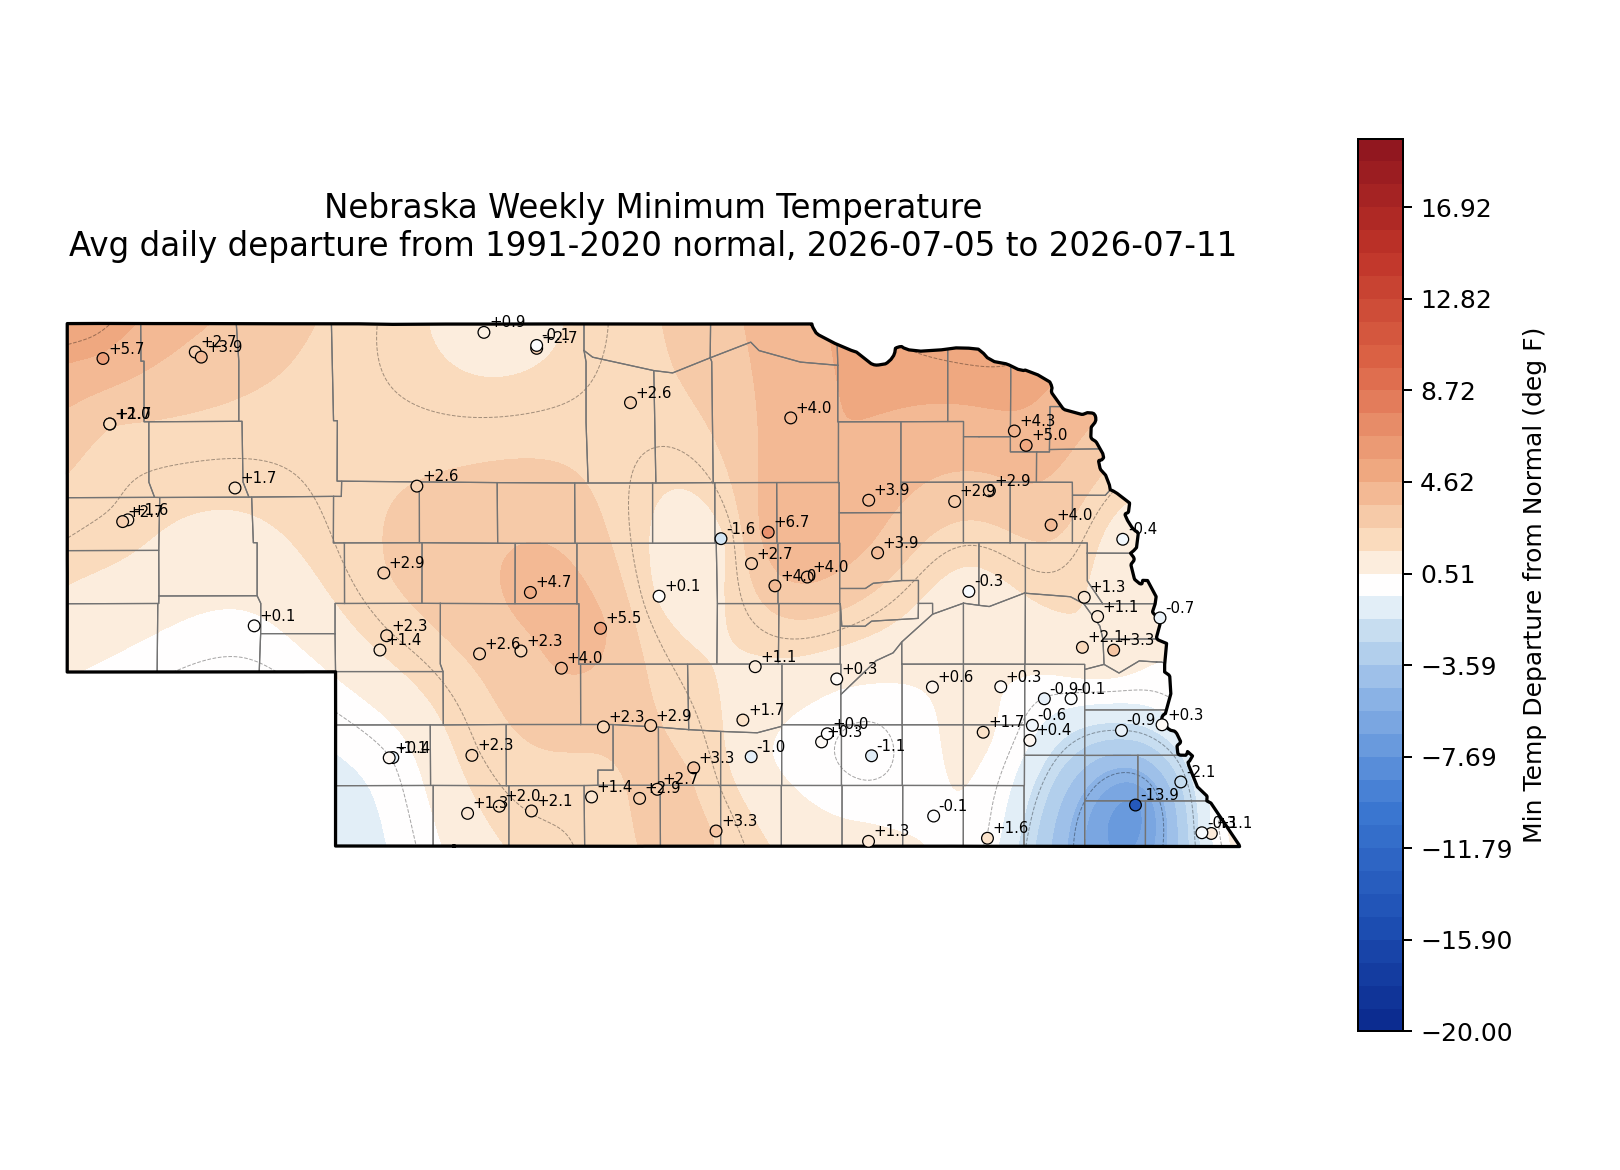
Minimum Temperature
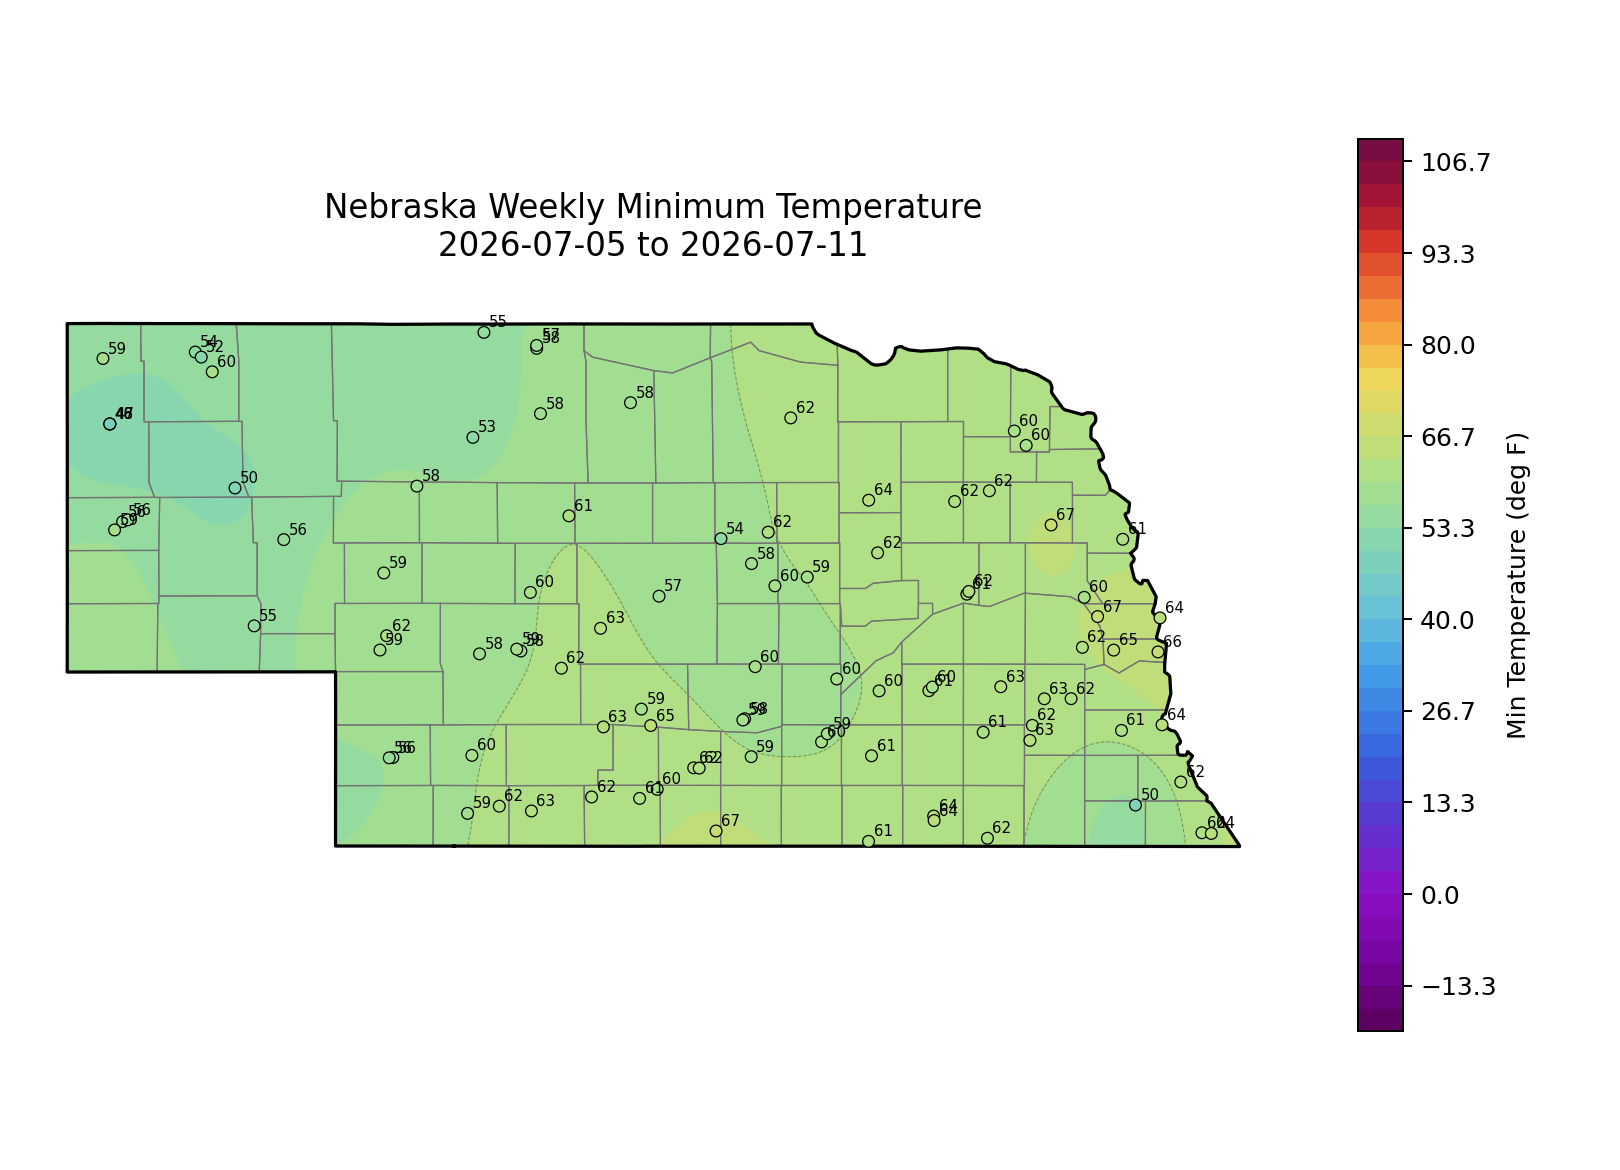
The lowest temperature was 46°F 20 miles south-southeast of Harrison on Sunday.
Precipitation
The most amount of precipitation we saw was in Hemingford, where they received 4.74 inches of rain.
Station Summary Table
| Station | Station ID | Avg Max Temp | Avg Min Temp | Avg Temp | Max Temp | Min Temp | GDD base 50 | HDD base 65 | CDD base 65 | Days Max > 90F | Days Min > 70F | Days Max < 32F | Days Min < 0F | Total Precip |
| ALLIANCE MUNICIPAL AIRPORT ASOS | KAIA | 93.6 | 56.6 | 75.1 | 99 | 50 | 176 | 0 | 70 | 4 | 0 | 0 | 0 | 0.17 |
| BROKEN BOW MUNICIPAL AP | KBBW | 87.4 | 62.9 | 75.1 | 89 | 57 | 176 | 0 | 71 | 0 | 0 | 0 | 0 | 0.18 |
| CHADRON MUNICIPAL AP | KCDR | 96.6 | 61.3 | 78.9 | 101 | 54 | 202 | 0 | 98 | 6 | 1 | 0 | 0 | 0.25 |
| COLUMBUS | KOLU | 86.7 | 66.6 | 76.6 | 90 | 61 | 186 | 0 | 82 | 0 | 2 | 0 | 0 | 0.16 |
| FALLS CITY BRENNER FIELD | KFNB | 86.9 | 65.7 | 76.3 | 91 | 62 | 184 | 0 | 79 | 1 | 0 | 0 | 0 | 1.15 |
| GRAND ISLAND CENTRAL NE REGIONAL AP | KGRI | 89 | 65.6 | 77.3 | 95 | 60 | 191 | 0 | 86 | 2 | 0 | 0 | 0 | 0.18 |
| HASTINGS MUNICIPAL AIRPORT | KHSI | 89.6 | 65.9 | 77.7 | 97 | 60 | 194 | 0 | 89 | 3 | 1 | 0 | 0 | 0.53 |
| HOLDREGE BREWSTER FIELD AP | KHDE | 87.9 | 65.4 | 76.6 | 91 | 62 | 186 | 0 | 82 | 1 | 0 | 0 | 0 | 0 |
| IMPERIAL MUNICIPAL AP | KIML | 90.1 | 60.3 | 75.2 | 94 | 56 | 176 | 0 | 72 | 4 | 0 | 0 | 0 | 0.74 |
| LINCOLN AIRPORT | KLNK | 88.9 | 65.7 | 77.3 | 94 | 63 | 191 | 0 | 86 | 1 | 0 | 0 | 0 | 2.22 |
| MCCOOK MUNICIPAL AP | KMCK | 91.7 | 65.6 | 78.6 | 94 | 63 | 200 | 0 | 96 | 5 | 1 | 0 | 0 | 0.38 |
| NORFOLK KARL STEFAN MEMORIAL AP | KOFK | 90.1 | 65.9 | 78 | 92 | 62 | 196 | 0 | 91 | 5 | 1 | 0 | 0 | 0 |
| NORTH PLATTE REGIONAL AP | KLBF | 91.6 | 62.9 | 77.2 | 94 | 58 | 190 | 0 | 86 | 4 | 0 | 0 | 0 | 0.53 |
| OMAHA EPPLEY AIRFIELD | KOMA | 89.4 | 67.1 | 78.3 | 95 | 64 | 198 | 0 | 93 | 3 | 1 | 0 | 0 | 0.2 |
| ORD EVELYN SHARP FIELD | KODX | 89.1 | 64.1 | 76.6 | 91 | 58 | 186 | 0 | 82 | 1 | 0 | 0 | 0 | 0.02 |
| SCOTTSBLUFF W B HEILIG FIELD AP | KBFF | 93.3 | 60.6 | 76.9 | 99 | 56 | 188 | 0 | 84 | 4 | 0 | 0 | 0 | 0.76 |
| SIDNEY MUNICIPAL AP | KSNY | 0 | 0 | 0 | 0 | 0 | 0 | 0 | 0 | |||||
| TEKAMAH MUNICIPAL AP | KTQE | 89.6 | 63.9 | 76.7 | 94 | 61 | 187 | 0 | 82 | 3 | 0 | 0 | 0 | 1.41 |
| VALENTINE MILLER FIELD AP | KVTN | 92 | 63 | 77.5 | 96 | 58 | 192 | 0 | 88 | 6 | 0 | 0 | 0 | 0.05 |


