
Late season heatwave
A more potent cold front has cleared the state over the last 24 hours and brought some needed heat relief to all and beneficial rain to much of central and eastern Nebraska. But the previous 10 days were warm statewide and it was easily the hottest stretch of weather in 2026 for south central and southeast Nebraska. Average temperatures were above 80°F for most locations south of the Platte River (Figure 1) and were close to 85°F in places like Lincoln, Omaha, and Falls City. For Omaha and Lincoln the last 10 days were the hottest stretch of weather since 2012 and in Omaha, this was the second longest streak of maximum temperatures over 90°F in the last 50 years.
| Station | Station ID | Avg Max Temp | Avg Min Temp | Avg Temp | Max Temp | Min Temp | GDD base 50 | HDD base 65 | CDD base 65 | Days Max > 90F | Days Min > 70F | Days Max < 32F | Days Min < 0F | Total Precip |
| ALLIANCE MUNICIPAL AIRPORT ASOS | KAIA | 89.1 | 56.4 | 72.8 | 96 | 51 | 228 | 0 | 78 | 4 | 0 | 0 | 0 | 1.69 |
| BROKEN BOW MUNICIPAL AP | KBBW | 89.2 | 62.8 | 76.0 | 96 | 59 | 260 | 0 | 110 | 2 | 0 | 0 | 0 | 0.86 |
| COLUMBUS | KOLU | 91.4 | 70.4 | 80.9 | 95 | 68 | 278 | 0 | 144 | 6 | 4 | 0 | 0 | 0.08 |
| FALLS CITY BRENNER FIELD | KFNB | 97.6 | 71.7 | 84.6 | 100 | 68 | 346 | 0 | 196 | 10 | 8 | 0 | 0 | 0.23 |
| GRAND ISLAND CENTRAL NE REGIONAL AP | KGRI | 92.4 | 70.2 | 81.3 | 99 | 68 | 313 | 0 | 163 | 6 | 6 | 0 | 0 | 0.08 |
| HASTINGS MUNICIPAL AIRPORT | KHSI | 93.0 | 70.8 | 81.9 | 98 | 69 | 319 | 0 | 169 | 7 | 7 | 0 | 0 | 0.03 |
| HOLDREGE BREWSTER FIELD AP | KHDE | 94.3 | 68.3 | 81.3 | 98 | 67 | 188 | 0 | 98 | 5 | 0 | 0 | 0 | N/A |
| IMPERIAL MUNICIPAL AP | KIML | 93.6 | 62.4 | 78.0 | 98 | 59 | 280 | 0 | 130 | 9 | 0 | 0 | 0 | 0.25 |
| LINCOLN AIRPORT | KLNK | 96.7 | 73.2 | 85.0 | 101 | 70 | 350 | 0 | 200 | 10 | 10 | 0 | 0 | 0.40 |
| MCCOOK MUNICIPAL AP | KMCK | 93.4 | 66.2 | 79.8 | 100 | 63 | 298 | 0 | 148 | 8 | 0 | 0 | 0 | 1.61 |
| NORFOLK KARL STEFAN MEMORIAL AP | KOFK | 90.4 | 68.6 | 79.5 | 96 | 67 | 295 | 0 | 145 | 7 | 1 | 0 | 0 | 0.21 |
| NORTH PLATTE REGIONAL AP | KLBF | 91.5 | 62.5 | 77.0 | 96 | 58 | 270 | 0 | 120 | 8 | 0 | 0 | 0 | 1.08 |
| OMAHA EPPLEY AIRFIELD | KOMA | 95.0 | 73.7 | 84.4 | 98 | 69 | 344 | 0 | 194 | 10 | 9 | 0 | 0 | 0.72 |
| ORD EVELYN SHARP FIELD | KODX | 90.0 | 64.8 | 77.4 | 96 | 60 | 274 | 0 | 124 | 3 | 0 | 0 | 0 | 0.29 |
| SCOTTSBLUFF W B HEILIG FIELD AP | KBFF | 91.8 | 57.8 | 74.8 | 98 | 53 | 248 | 0 | 98 | 6 | 0 | 0 | 0 | 0.02 |
| SIDNEY MUNICIPAL AP | KSNY | 90.5 | 59.4 | 75.0 | 96 | 56 | 250 | 0 | 100 | 5 | 0 | 0 | 0 | 1.17 |
| TEKAMAH MUNICIPAL AP | KTQE | 89.9 | 68.8 | 79.4 | 94 | 67 | 294 | 0 | 144 | 4 | 3 | 0 | 0 | 1.36 |
| VALENTINE MILLER FIELD AP | KVTN | 91.1 | 61.5 | 76.3 | 97 | 53 | 263 | 0 | 113 | 5 | 1 | 0 | 0 | 0.04 |
Table 1. Temperature and precipitation table over the last 10 days
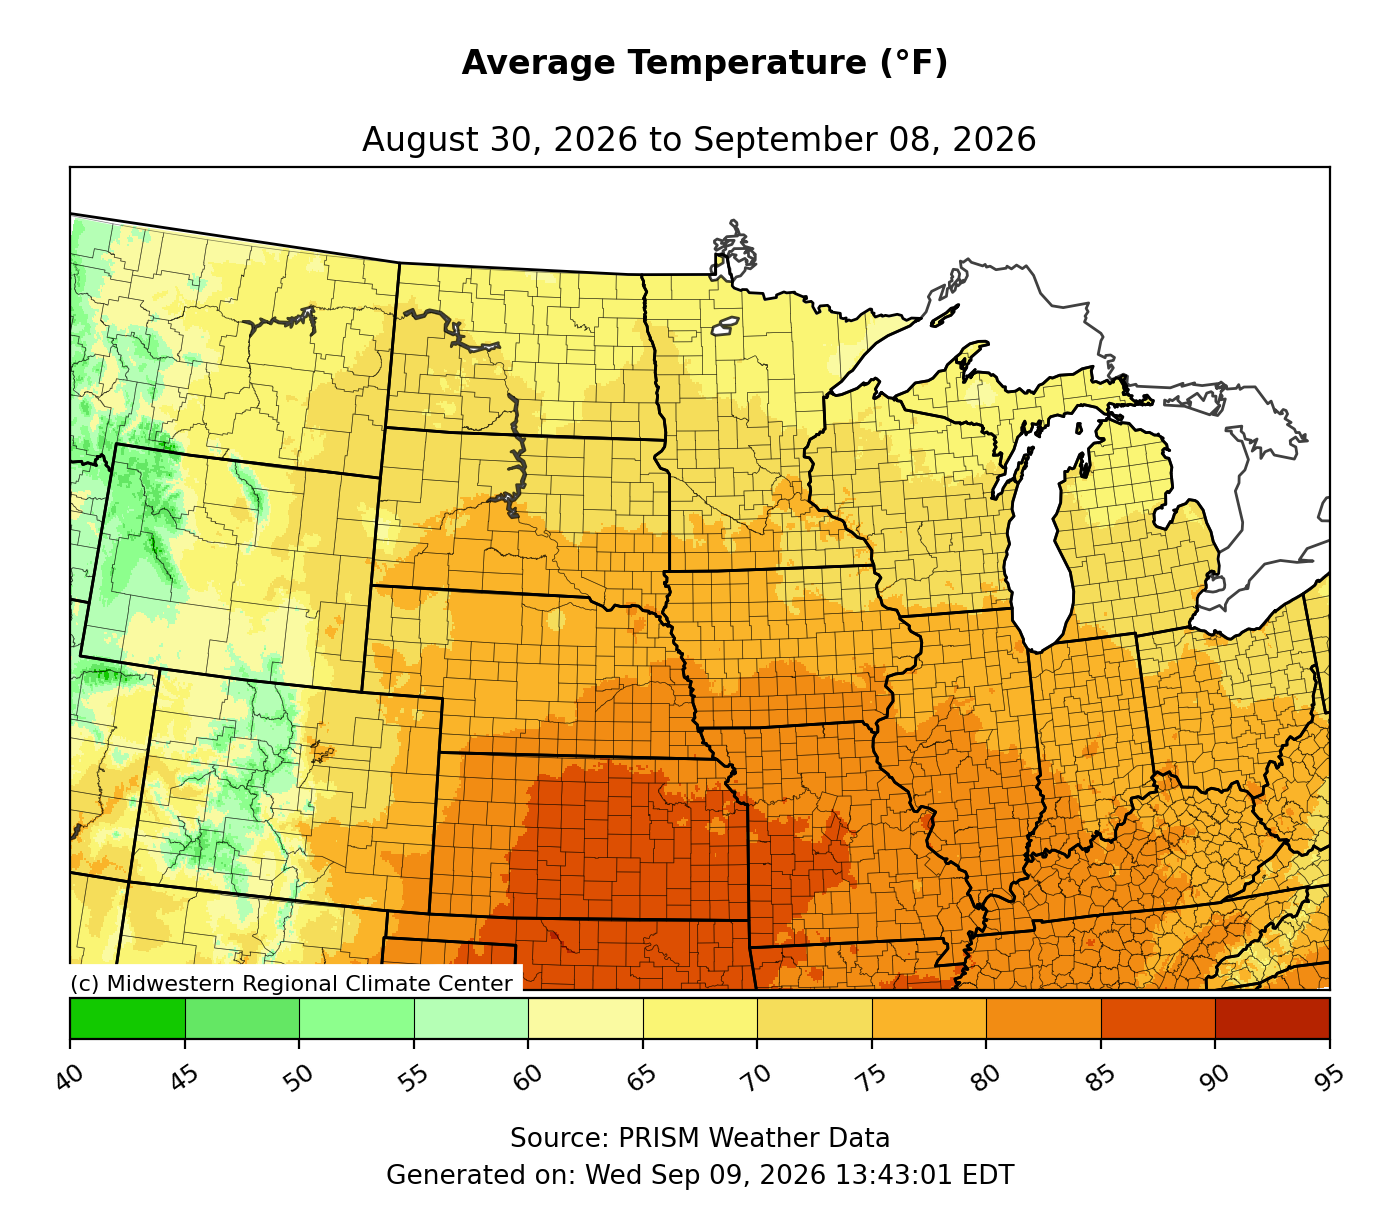
Figure 1. Average temperature between August 30 and September 8
Very warm nights
While all of the state had warm afternoons, the overnight temperatures were much warmer in the southeast Nebraska as minimum temperatures were consistently staying in the 70's. Temperatures were often over 75°F at night between last Tuesday and this Sunday morning. The Havelock Mesonet site had a low of 83°F last Thursday, which is the warmest minimum temperature ever recorded in Lincoln in September. That site also remained above 80°F from early last Tuesday morning to Friday morning, which would be a rare feat in the middle of summer.
This was 10th longest streak of temperatures above 70°F in Lincoln with 11 straight days. This easily was the longest run of days with minimum temperatures over 70°F that started after August 20th. All previous such streaks had a start date in July or the first half of August. Other sites had at least one reading below 70°F so Lincoln was the only long-term site that managed a top-10 streak over 70°F.
The abundant rainfall in mid-August meant that most of the main corn-soybean areas had sufficient moisture going into the heat wave. Otherwise, we would have a flash drought story to talk about as well and still could if rain projected over the next 10 days fails to pan out. But the very warm temperatures at night did lead to accelerated accumulation of growing units and this may have shaved a bit more off corn yield potential in south central and southeast Nebraska. This likely also was the story into much of Iowa and Illinois as well. Will be interesting to see how much this affects final yield numbers in those states.
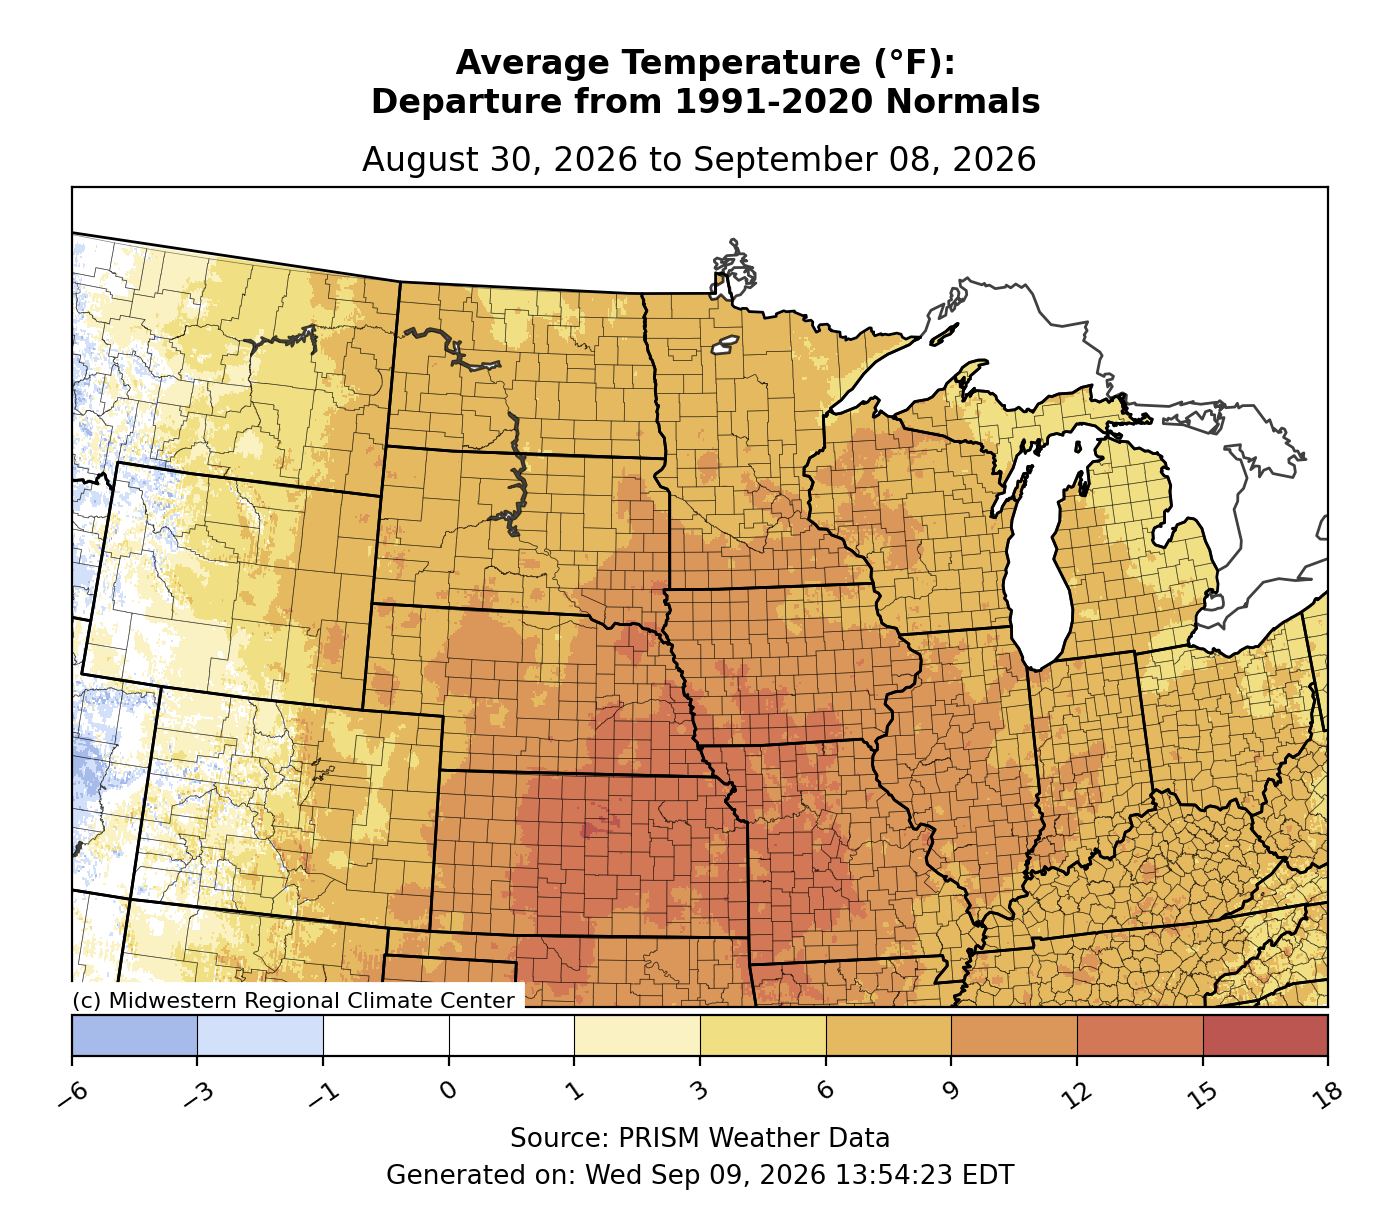
Figure 2. Temperature departure from normal between August 30 and September 8
Why was it so hot?
The upper air pattern for much of the last 7-10 days featured a deep upper-level trough of low pressure over the Pacific Northwest and a ridge over the southern part of the country.
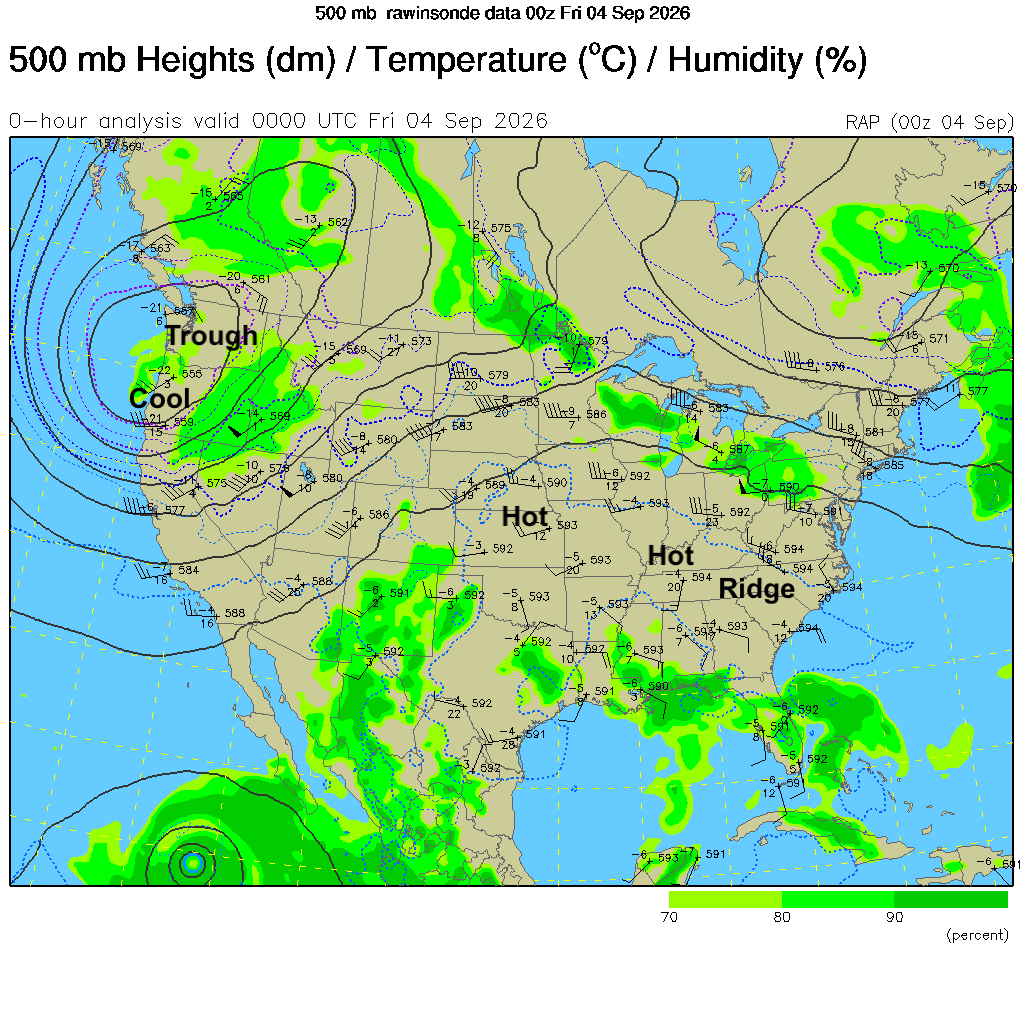
Figure 3. The 500-mb chart from last Thursday evening (00Z Friday)
This upper air pattern kept the pumpkin-spice weather confined to the northwestern U.S. and western Canada and put areas between the Rockies, the Great Lakes, and the Appalachians in the heat. For climate divisions to our south in Kansas and Missouri it was the warmest common period on record and was top 10-warm over a broad area from Wyoming to Ohio and from Minnesota to Mississippi and Alabama. This heat led to record warm college football games for some locations in the South and Midwest over the weekend.

Figure 4. Temperature rankings in the period from August 30 to September 8
Is this a new normal?
Late summer into early fall heat is not necessarily a new thing and there was a comparably hot stretch in late August an early September of 1990 for the central and southeastern U.S. Other years in the past (1913, 1939) also featured very hot weather to start September in our region. So this was not entirely without precedent.
In general though, we are seeing some of our strongest upward trends in temperature in the month of September and these sultry, late season heat waves will be more common for us in the future when upper level ridging is dominant over the southern U.S. The increased atmospheric moisture (warmer air can hold more moisture) will also mean these early fall heat waves can still feature mid-to-late summer humidity when drought is not an issue. Perhaps the biggest difference between this heat wave and the one in 1990 are the minimum temperatures were lower in part because the dew points were noticeably lower. Thus, the heat then was less dangerous and more tolerable for the average person.

