
Primary network types
The Automated Surface Observing System (ASOS) stations are traditionally at airports. The traditional state run meso-scale networks called Mesonets are typically on privately owned land and more focused on agricultural needs. The ASOS station observations can be found in various places but I recommend using the recently updated Aviation Weather website or the old-school RAP surface page. More information on both types of networks can be found under Related Links.
Important terms
Dewpoint: the temperature at which condensation droplets will start to form. The higher the number the more humid it will feel.
Wet bulb temperature: the lowest temperature that can be achieved through evaporation alone at constant pressure. The higher the number, the more uncomfortable it will feel. It also will give more insight into how dangerous the heat is.
Wind direction: The direction the wind is blowing from.
Relative humidity: Actual vapor pressure/saturated vapor pressure at a given temperature. We will discuss this term more later this semester.
Standard observations at an ASOS station
The most standard observations at any automated weather station are the temperature, dew point, wind speed, wind direction, and sea-level adjusted pressure. ASOS stations will report visibility and the presence of precipitation (rain, snow) and fog, and cloud heights. An example of an observation from an ASOS site is shown below in Figure 1.
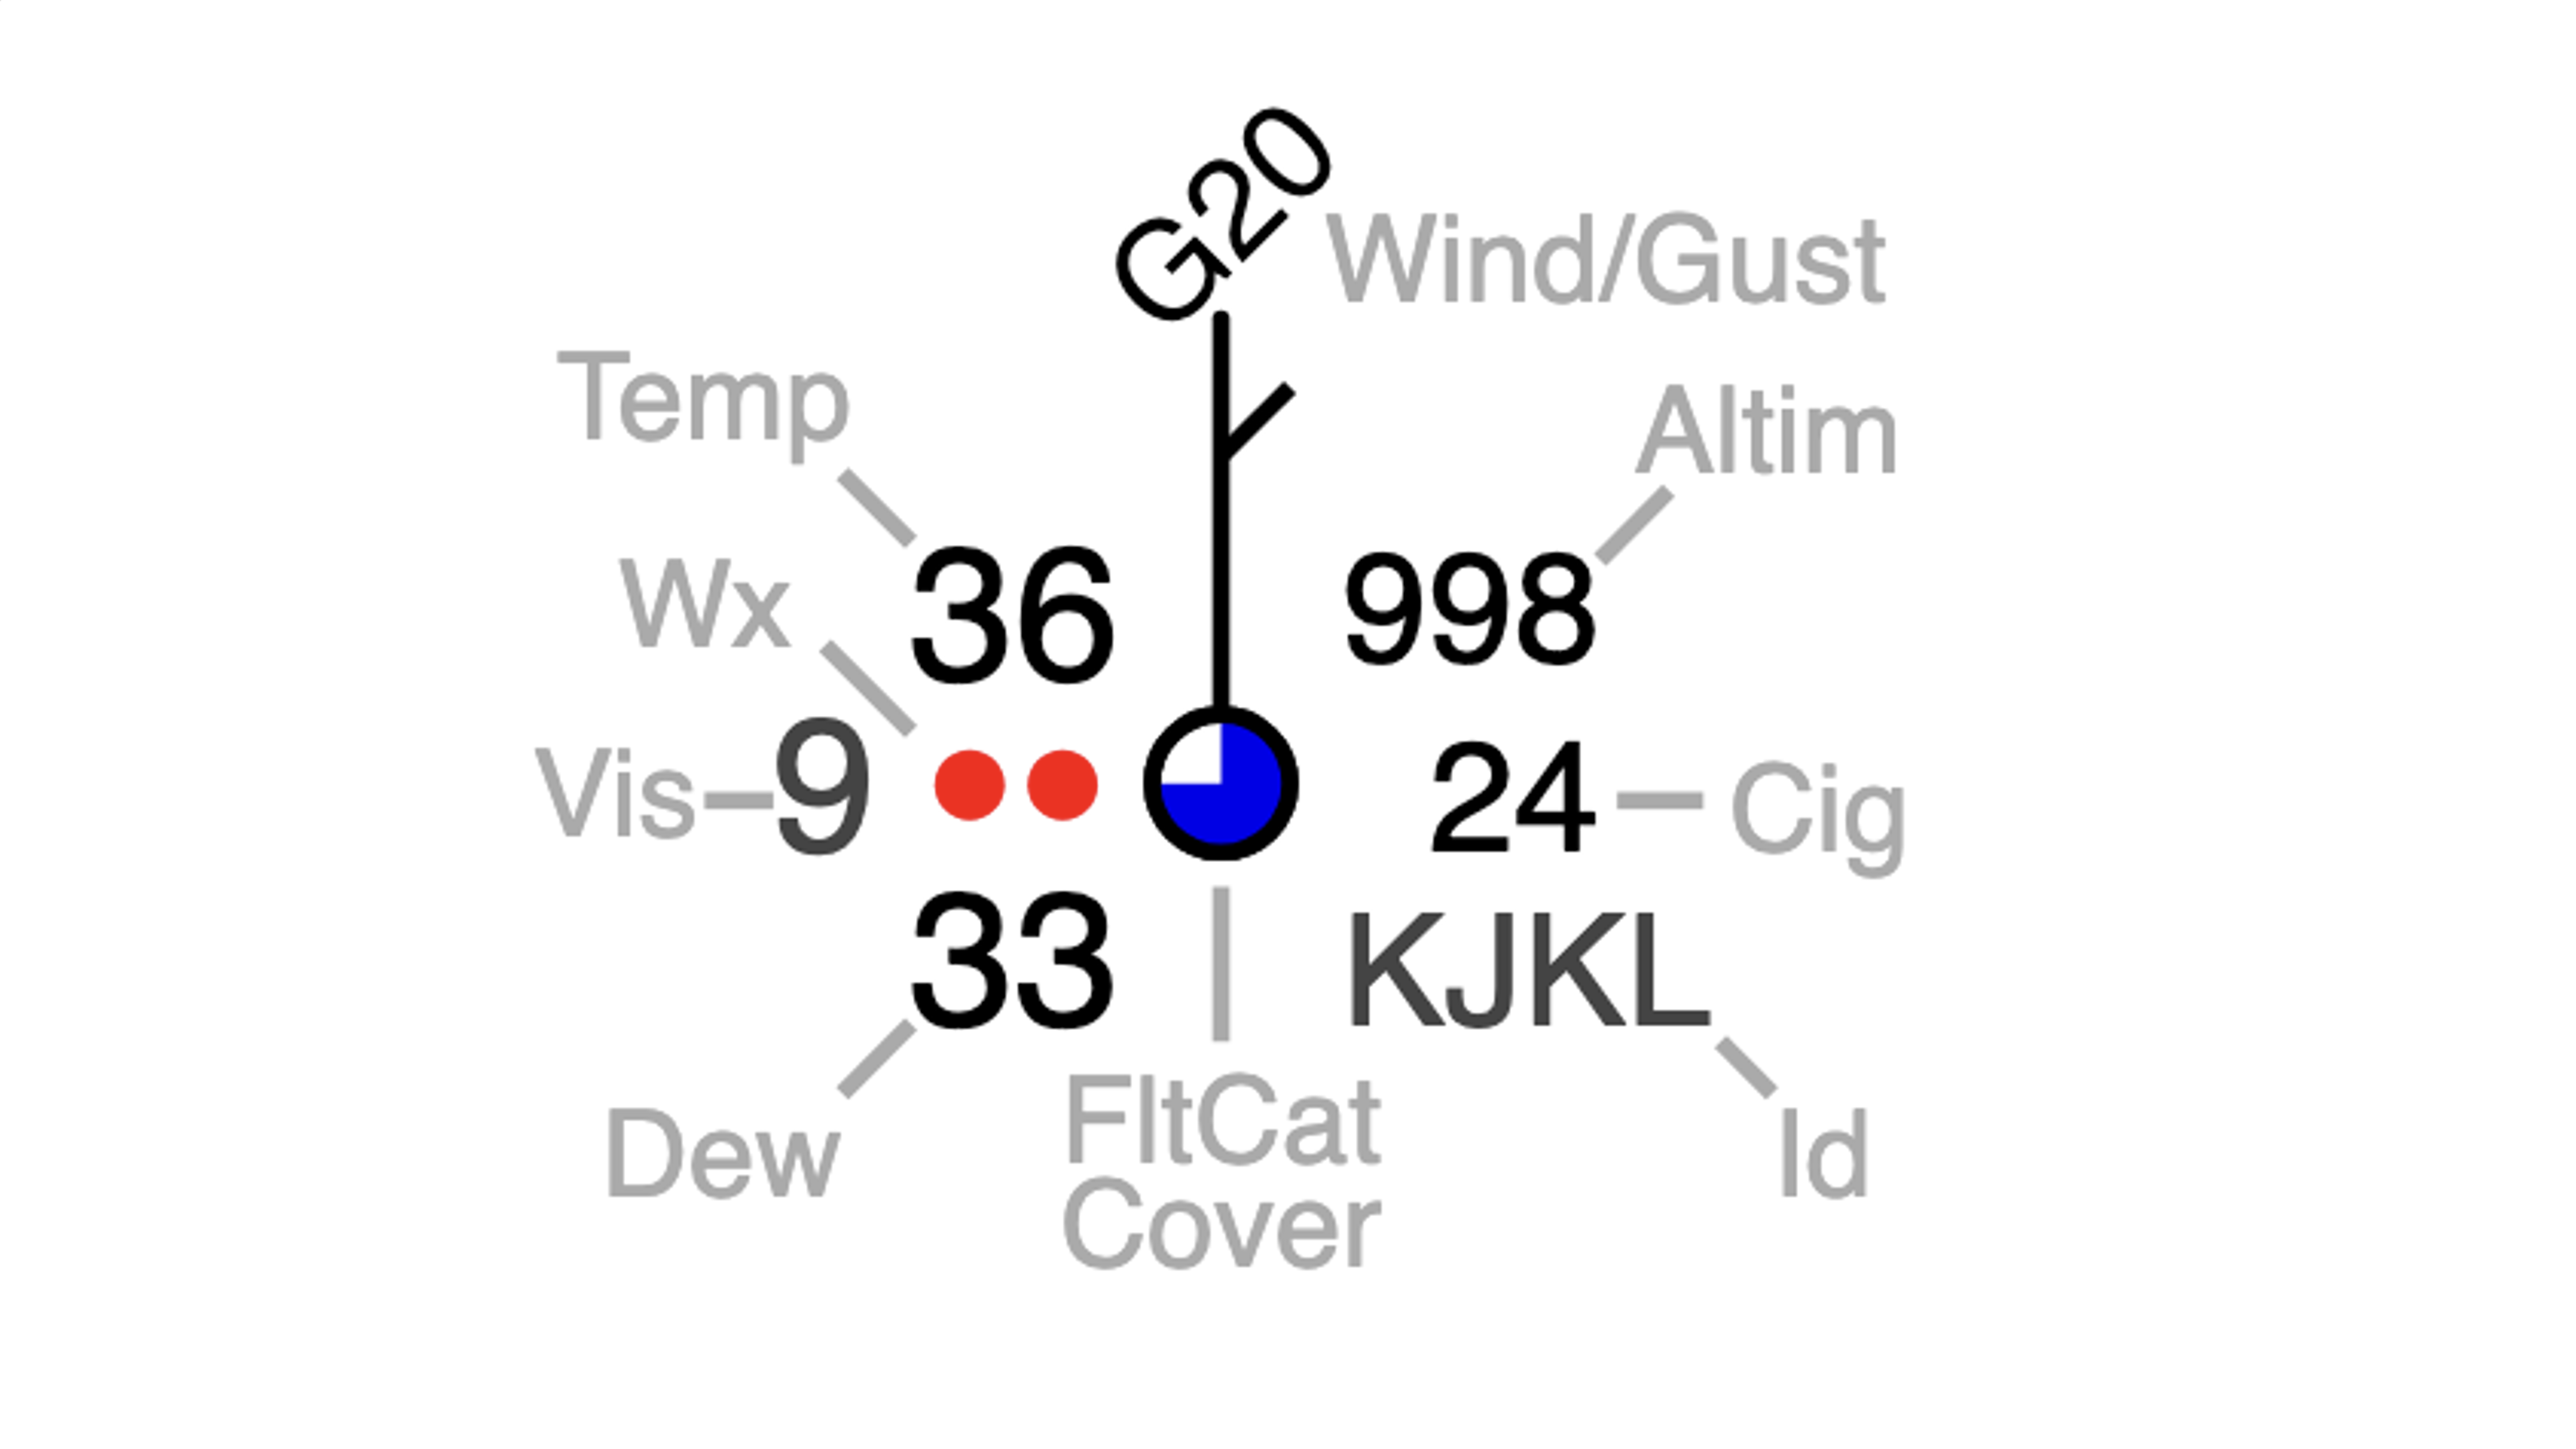
Figure 1. Example of a current observation from an ASOS station
In this example, the temperature is 36°F, the dew point is 33°F, the pressure is 998 mb, and the winds are from the northeast at 5 mph with gusts to 20 mph. The station is reporting light rain, mostly cloudy skies, and visibility of 9 miles. The station's identifier is KJKL.
Mesonet station observations
The mesonet stations around the country will generally not report report the presence of precipitation, visibility, or cloud heights as those are more crucial for aviation. However, they will report current values of variables important to agricultural production or human health. Examples include solar radiation
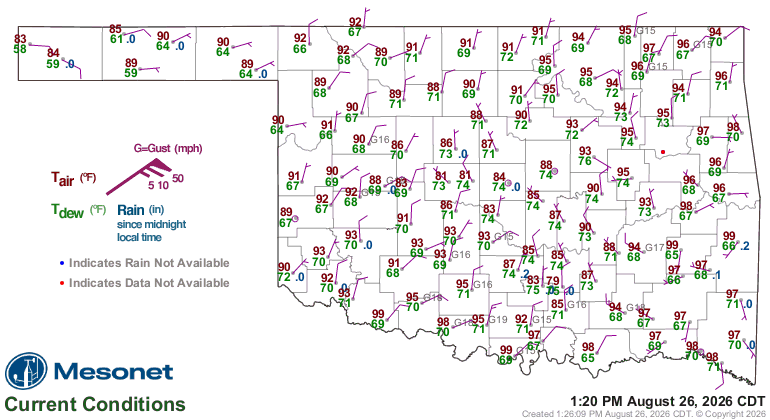
Figure 2. Surface observations at Oklahoma Mesonet stations.
A meteogram is a graphical representation of the weather over a period of time- often the previous 24 hours. In the figure below, the op box shows the temperature (red shade), dew point (green), and heat index (red line). The box below shows the wind speed (blue bars) and the wind direction (circles that correspond the left y-axis). The third box shows the station pressure, the fourth box shows total accumulated precipitation, and the bottom box shows the solar radiation curve. Near-perfect overlap between the orange and gray represents clear skies while a large gap between possible (gray) and actual (orange) represents cloud cover. Meteograms are great visualizations of changes over the previous days and can show extreme events and/or big changes from say a frontal passage.
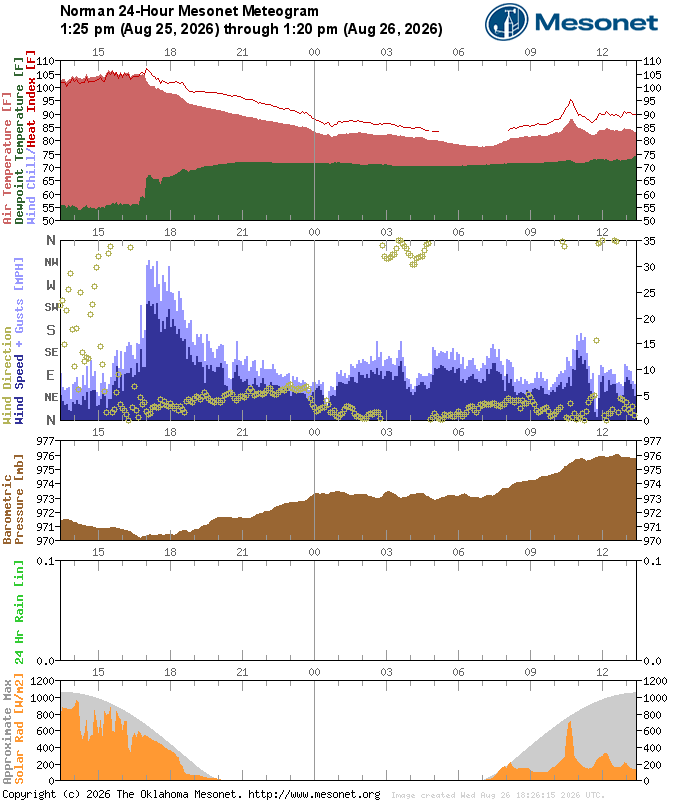
Figure 3. Meteogram from the Norman, OK Mesonet site.
One of the most important measurements from Mesonet sites can be soil temperature and soil moisture measurements. These can be critical for decision making, such as planting or irrigation decisions. A good example are the soil temperature measurements at the Nebraska Mesonet sites.
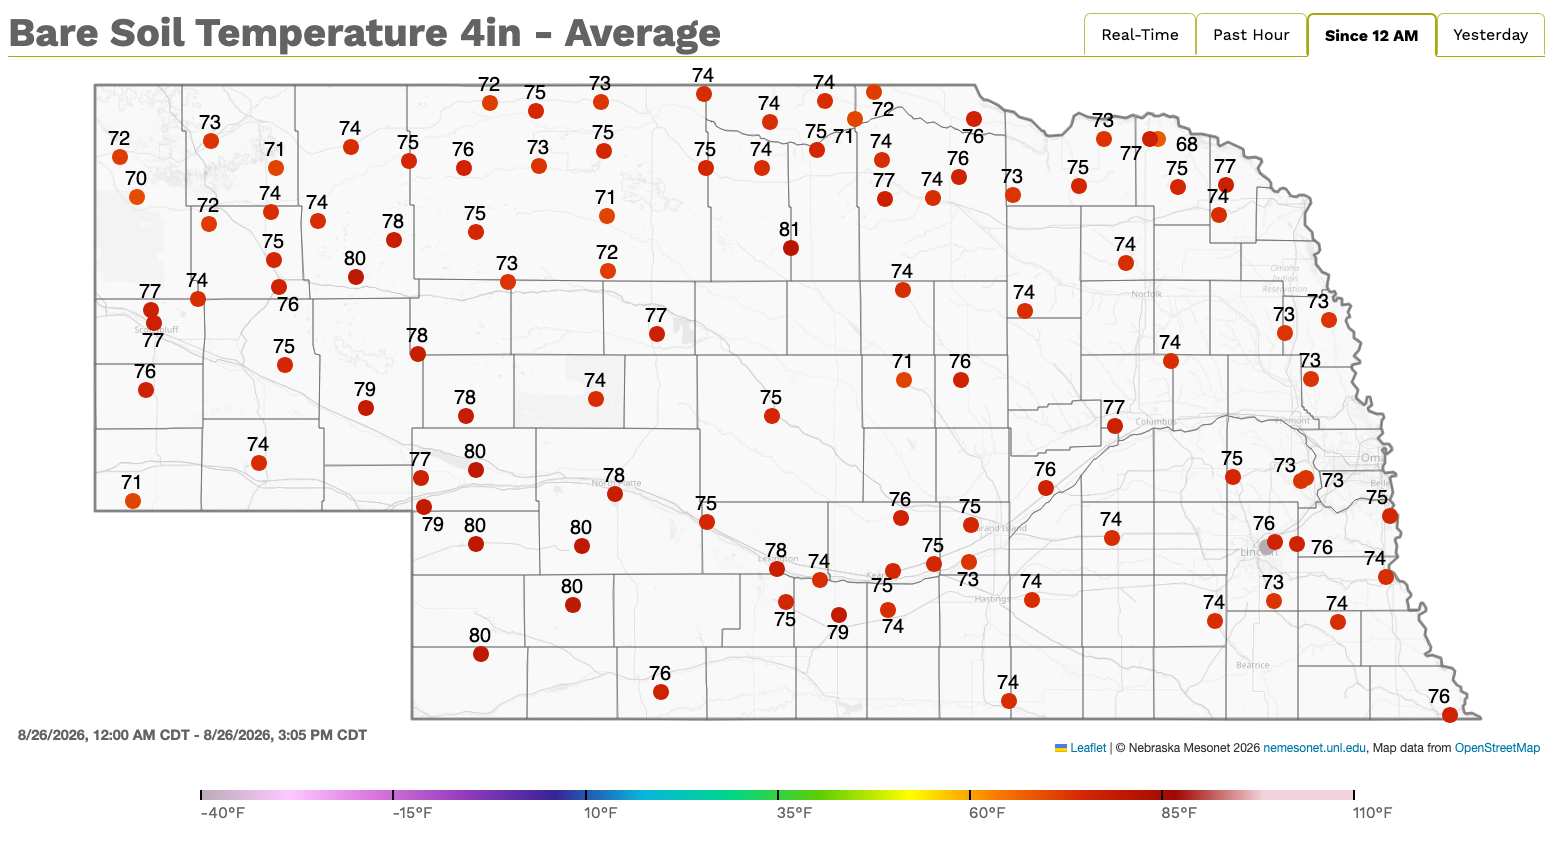
Figure 4. Soil temperature measurements
"Real-feel temperatures"
Heat index: This combines temperature and relative humidity to determine an apparent temperature. The WPC has a useful calculator to calculate heat index with different relative humidity (or dewpoint) and temperature. For example, a temperature of 95°F with a dewpoint of 70°F would yield a heat index of 102°F. A hot day but probably not reaching heat advisory thresholds for most of the U.S.
Heat Index = -42.379 + (2.04901523*T) + (10.14333127*RH) - (.22475541*T*RH) - (.00683783*T*T) - (.05481717*RH*RH) + (.00122874*T*T*RH) + (.00085282*T*RH*RH) - (.00000199*T*T*RH*RH)
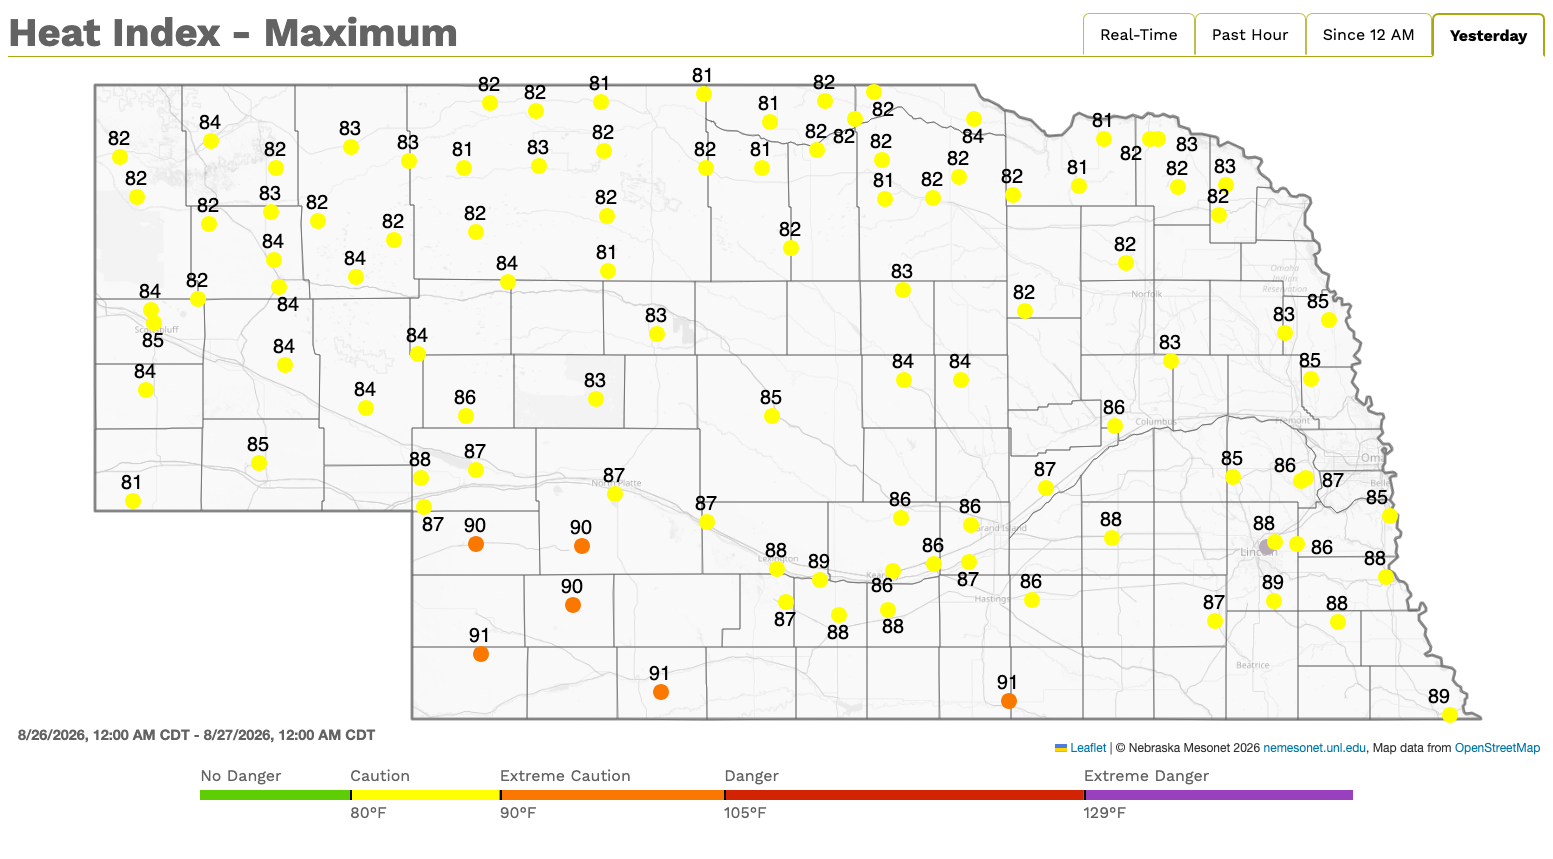
Figure 5. Maximum heat index values on Wednesday, August 26th
Wet-bulb global temperature: Conceptually similar to the heat index. But this metric also takes solar radiation and wind speed into account to determine how dangerous a hot day is. For example, a temperature of 95°F and a dewpoint of 70°F is going to be more dangerous (especially for vulnerable populations) if there is no wind and a high sun angle than if that same combination of temperature and dewpoint is coupled with some cloud cover and a 15 mph breeze to help induce evaporation.
The wet-bulb global temperature (WBGT) is technically unitless. It has been used by school administrators and public health officials to help determine danger levels and whether to take appropriate action, such as cancelling outdoor athletic practices or limiting outdoor recess.
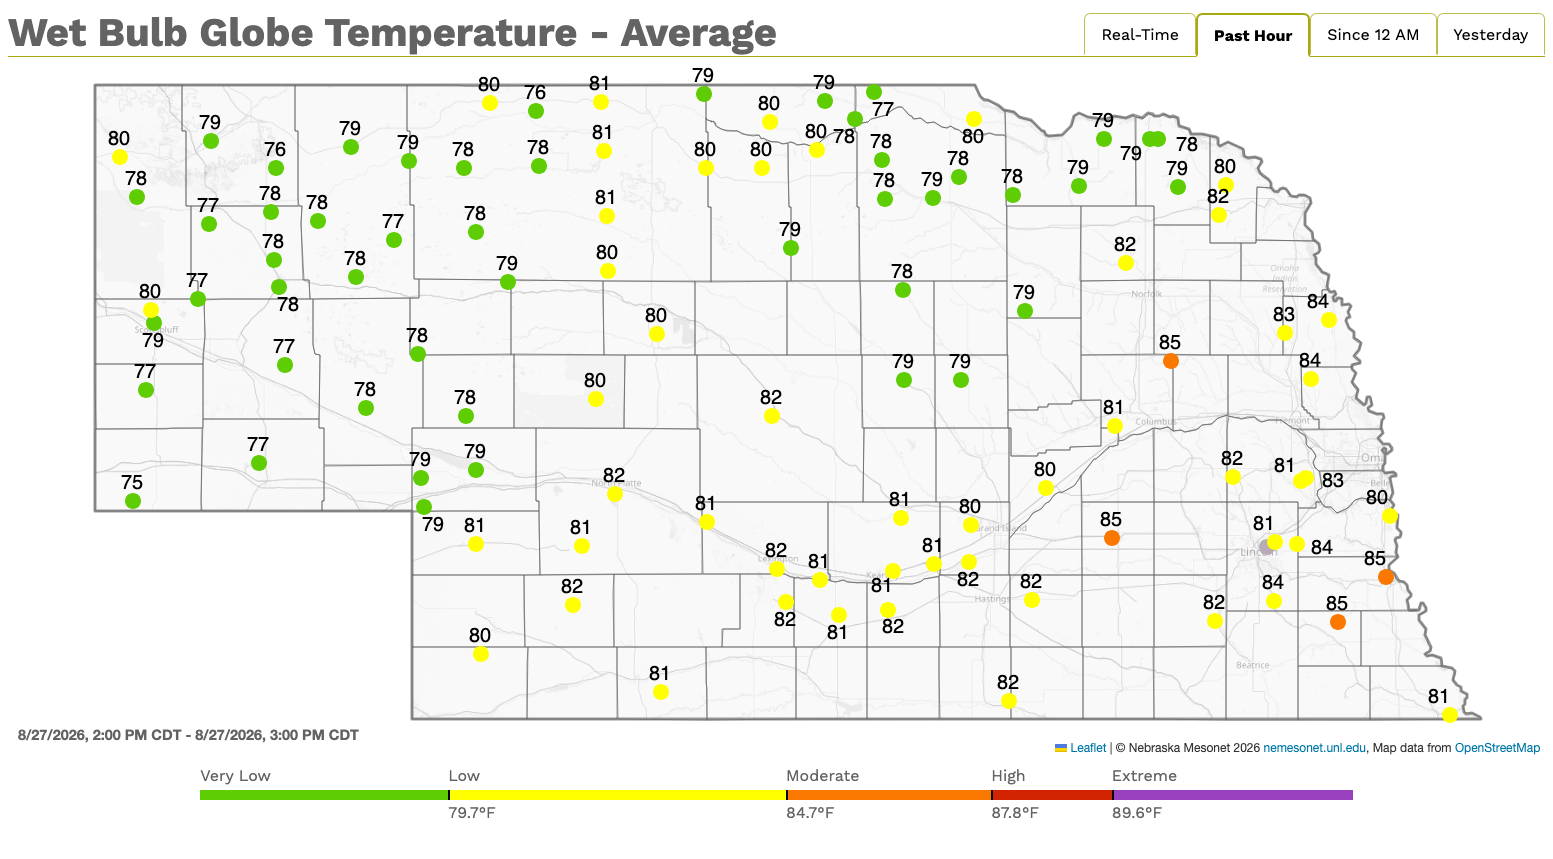
Figure 6. Average WBGT for Thursday, August 27th


