Drought keeps getting worse
The latest U.S. Drought Monitor shows that over 90 percent of the state is in drought and increasing percentages of the state are in severe, extreme, and exceptional drought. The worst areas continue to be the Panhandle and southwestern sections where exceptional drought now covers at least a portion of 17 counties.
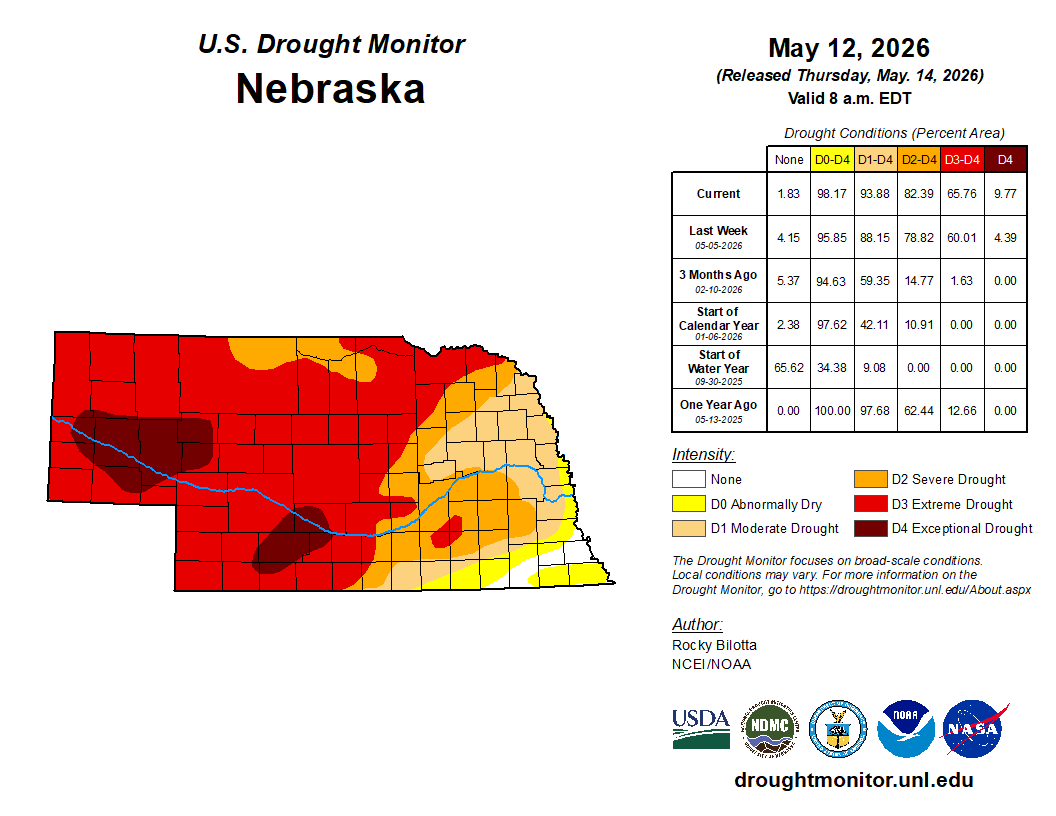
Figure 1. Latest U.S. Drought Monitor
The complete and in some cases, historic, lack of precipitation to start the month of May has also seen drought creep back into more of eastern Nebraska as well. Only a small area from Beatrice over toward Auburn is free and clear of drought and abnormal dryness on the latest map, but even that area has accumulated non-trivial precipitation deficits over 2 inches the last few weeks. The good news for southeast Nebraska is that short-term deficit may be eradicated and then some over the next several days.
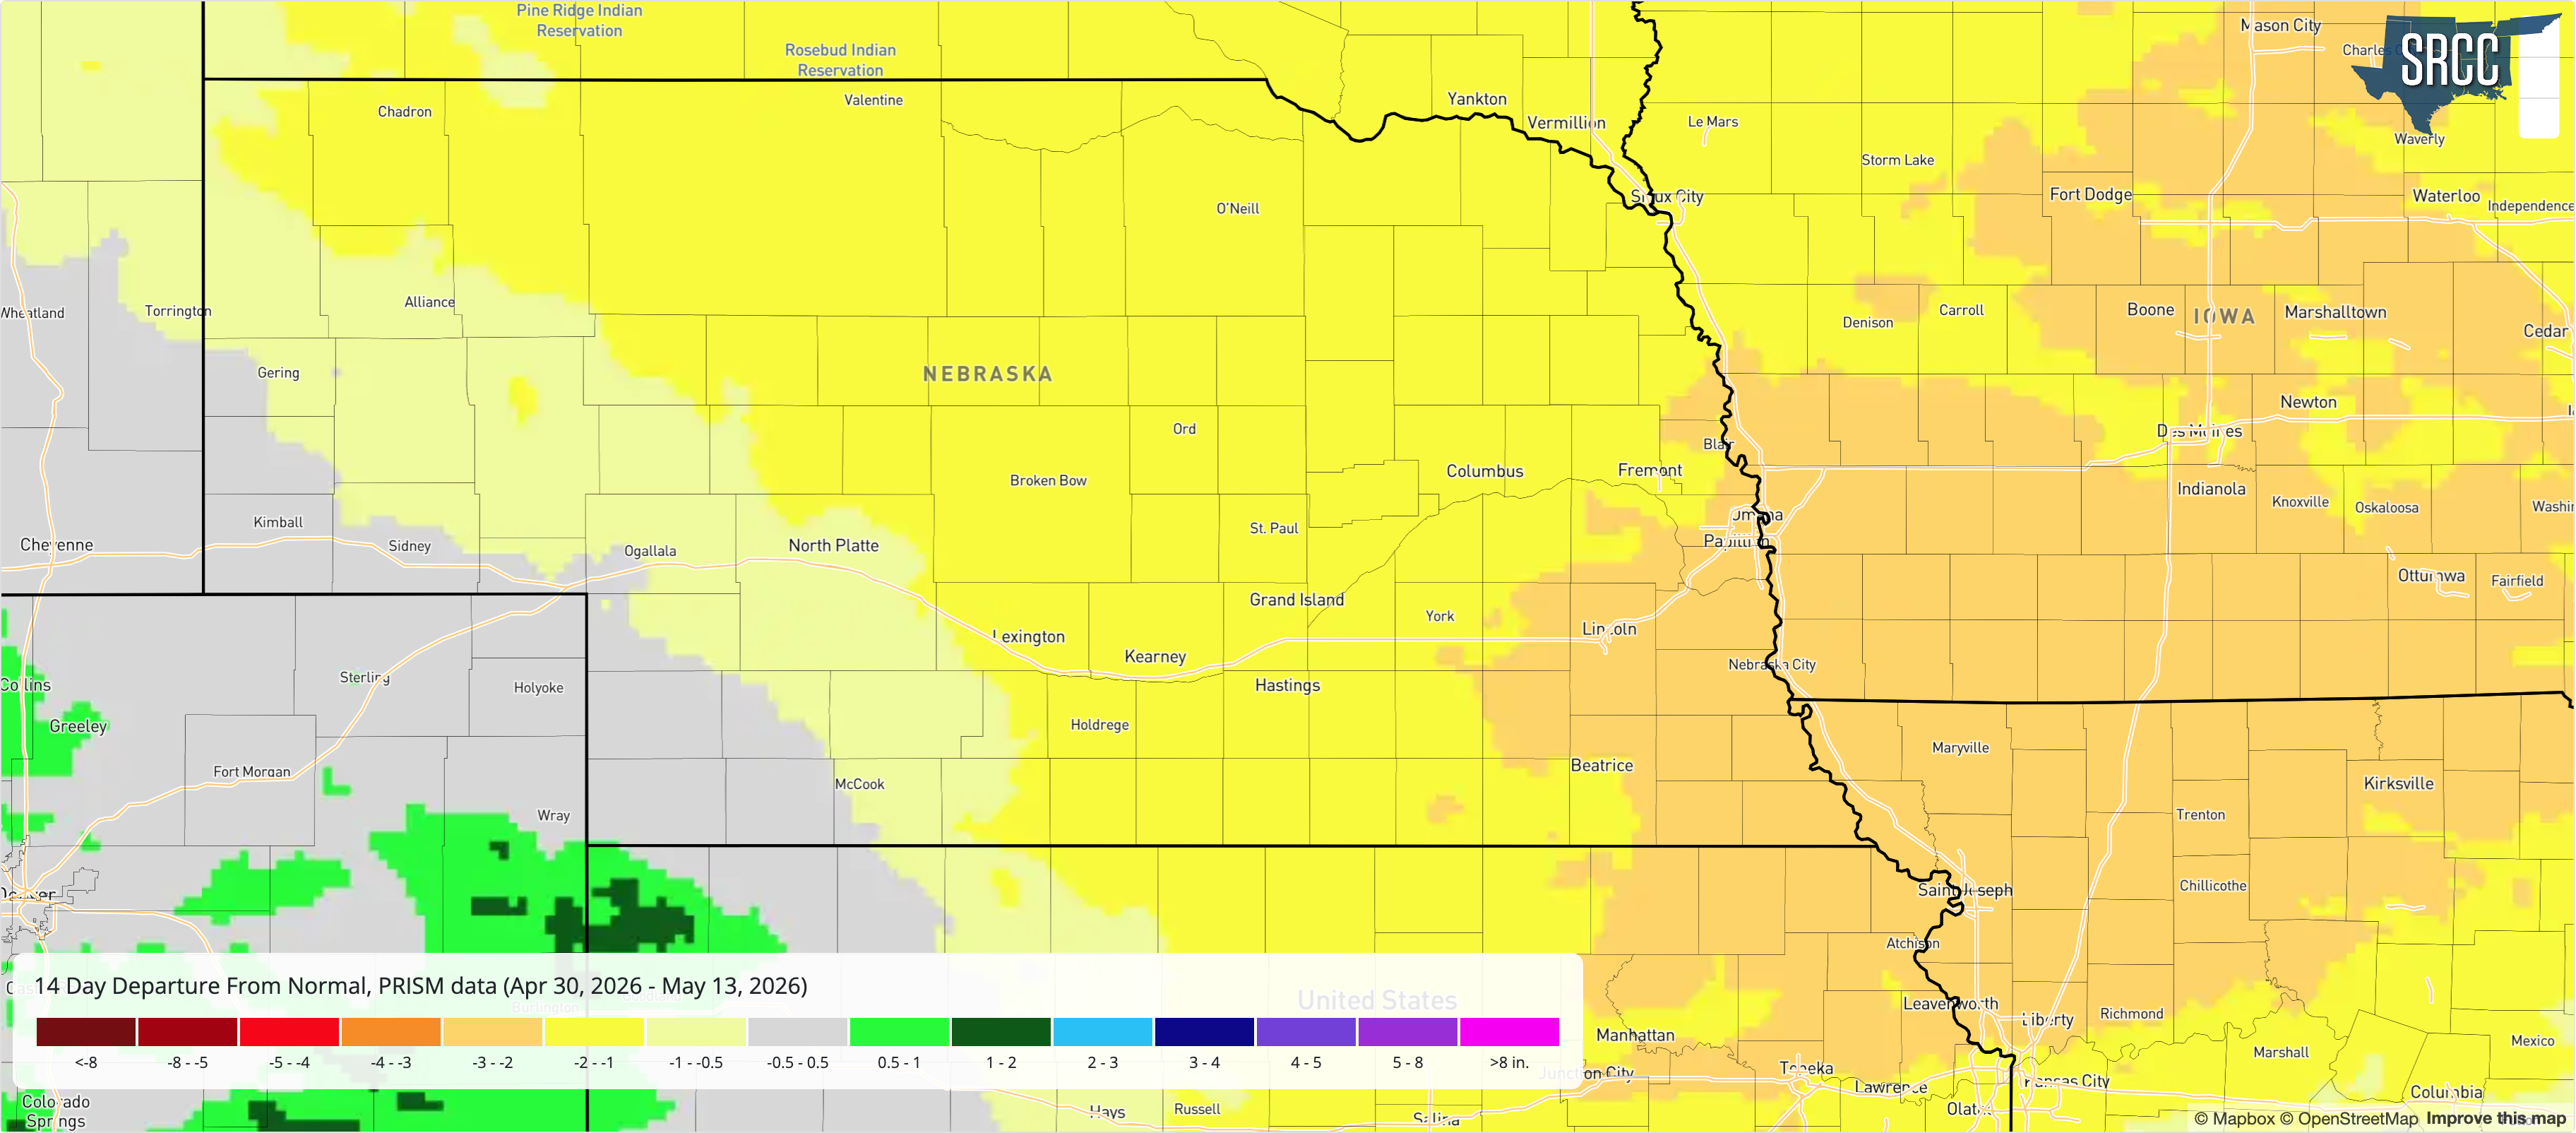
Figure 2. Precipitation deficits over the last 14-days according to PRISM.
Wheat disaster and struggling pastures
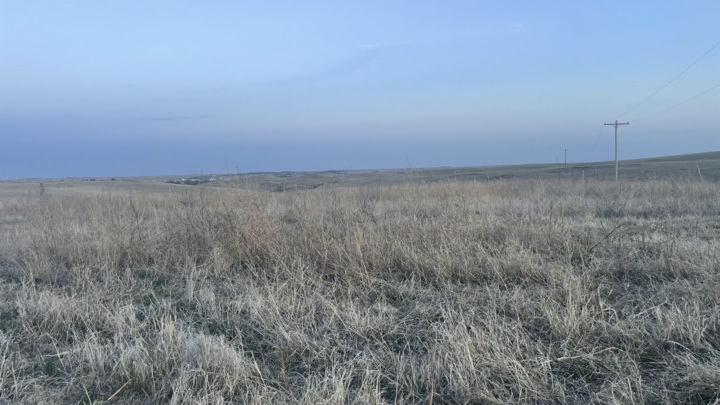
The latest NASS Crop Progress Report (released on Monday) had only 5 percent of pasture and range in the state in good to excellent condition; good for dead last in the country. The winter wheat crop isn't faring any better, with only 5 percent in good to excellent condition. Ratings on corn, soybean, and sorghum condition won't come out for a few more weeks yet. But pivots have been going in many areas in central, western, and northeastern Nebraska just to get crops to emerge. For some producers that is two years in a row of putting on water in the first half of May just to get things up.
We also are staring at what I believe may be the biggest winter wheat crop disaster the country has seen in decades. As of May 1, winter wheat abandonment was at 32 percent and that was factoring in 35 percent abandonment in Nebraska. Judging by what I hear from extension educators out west, there won't be much winter wheat harvested in the Panhandle and the situation in southwestern Nebraska is getting to that point for some too. Texas has over 70 percent abandonment and the figure below in a recent USDA report shows that a majority of the 'dots' for winter wheat are not just in drought; they are in severe to extreme drought. Even some places that haven't had drought issues have been dealing untimely frost and/or excessive wetness (e.g., Michigan).
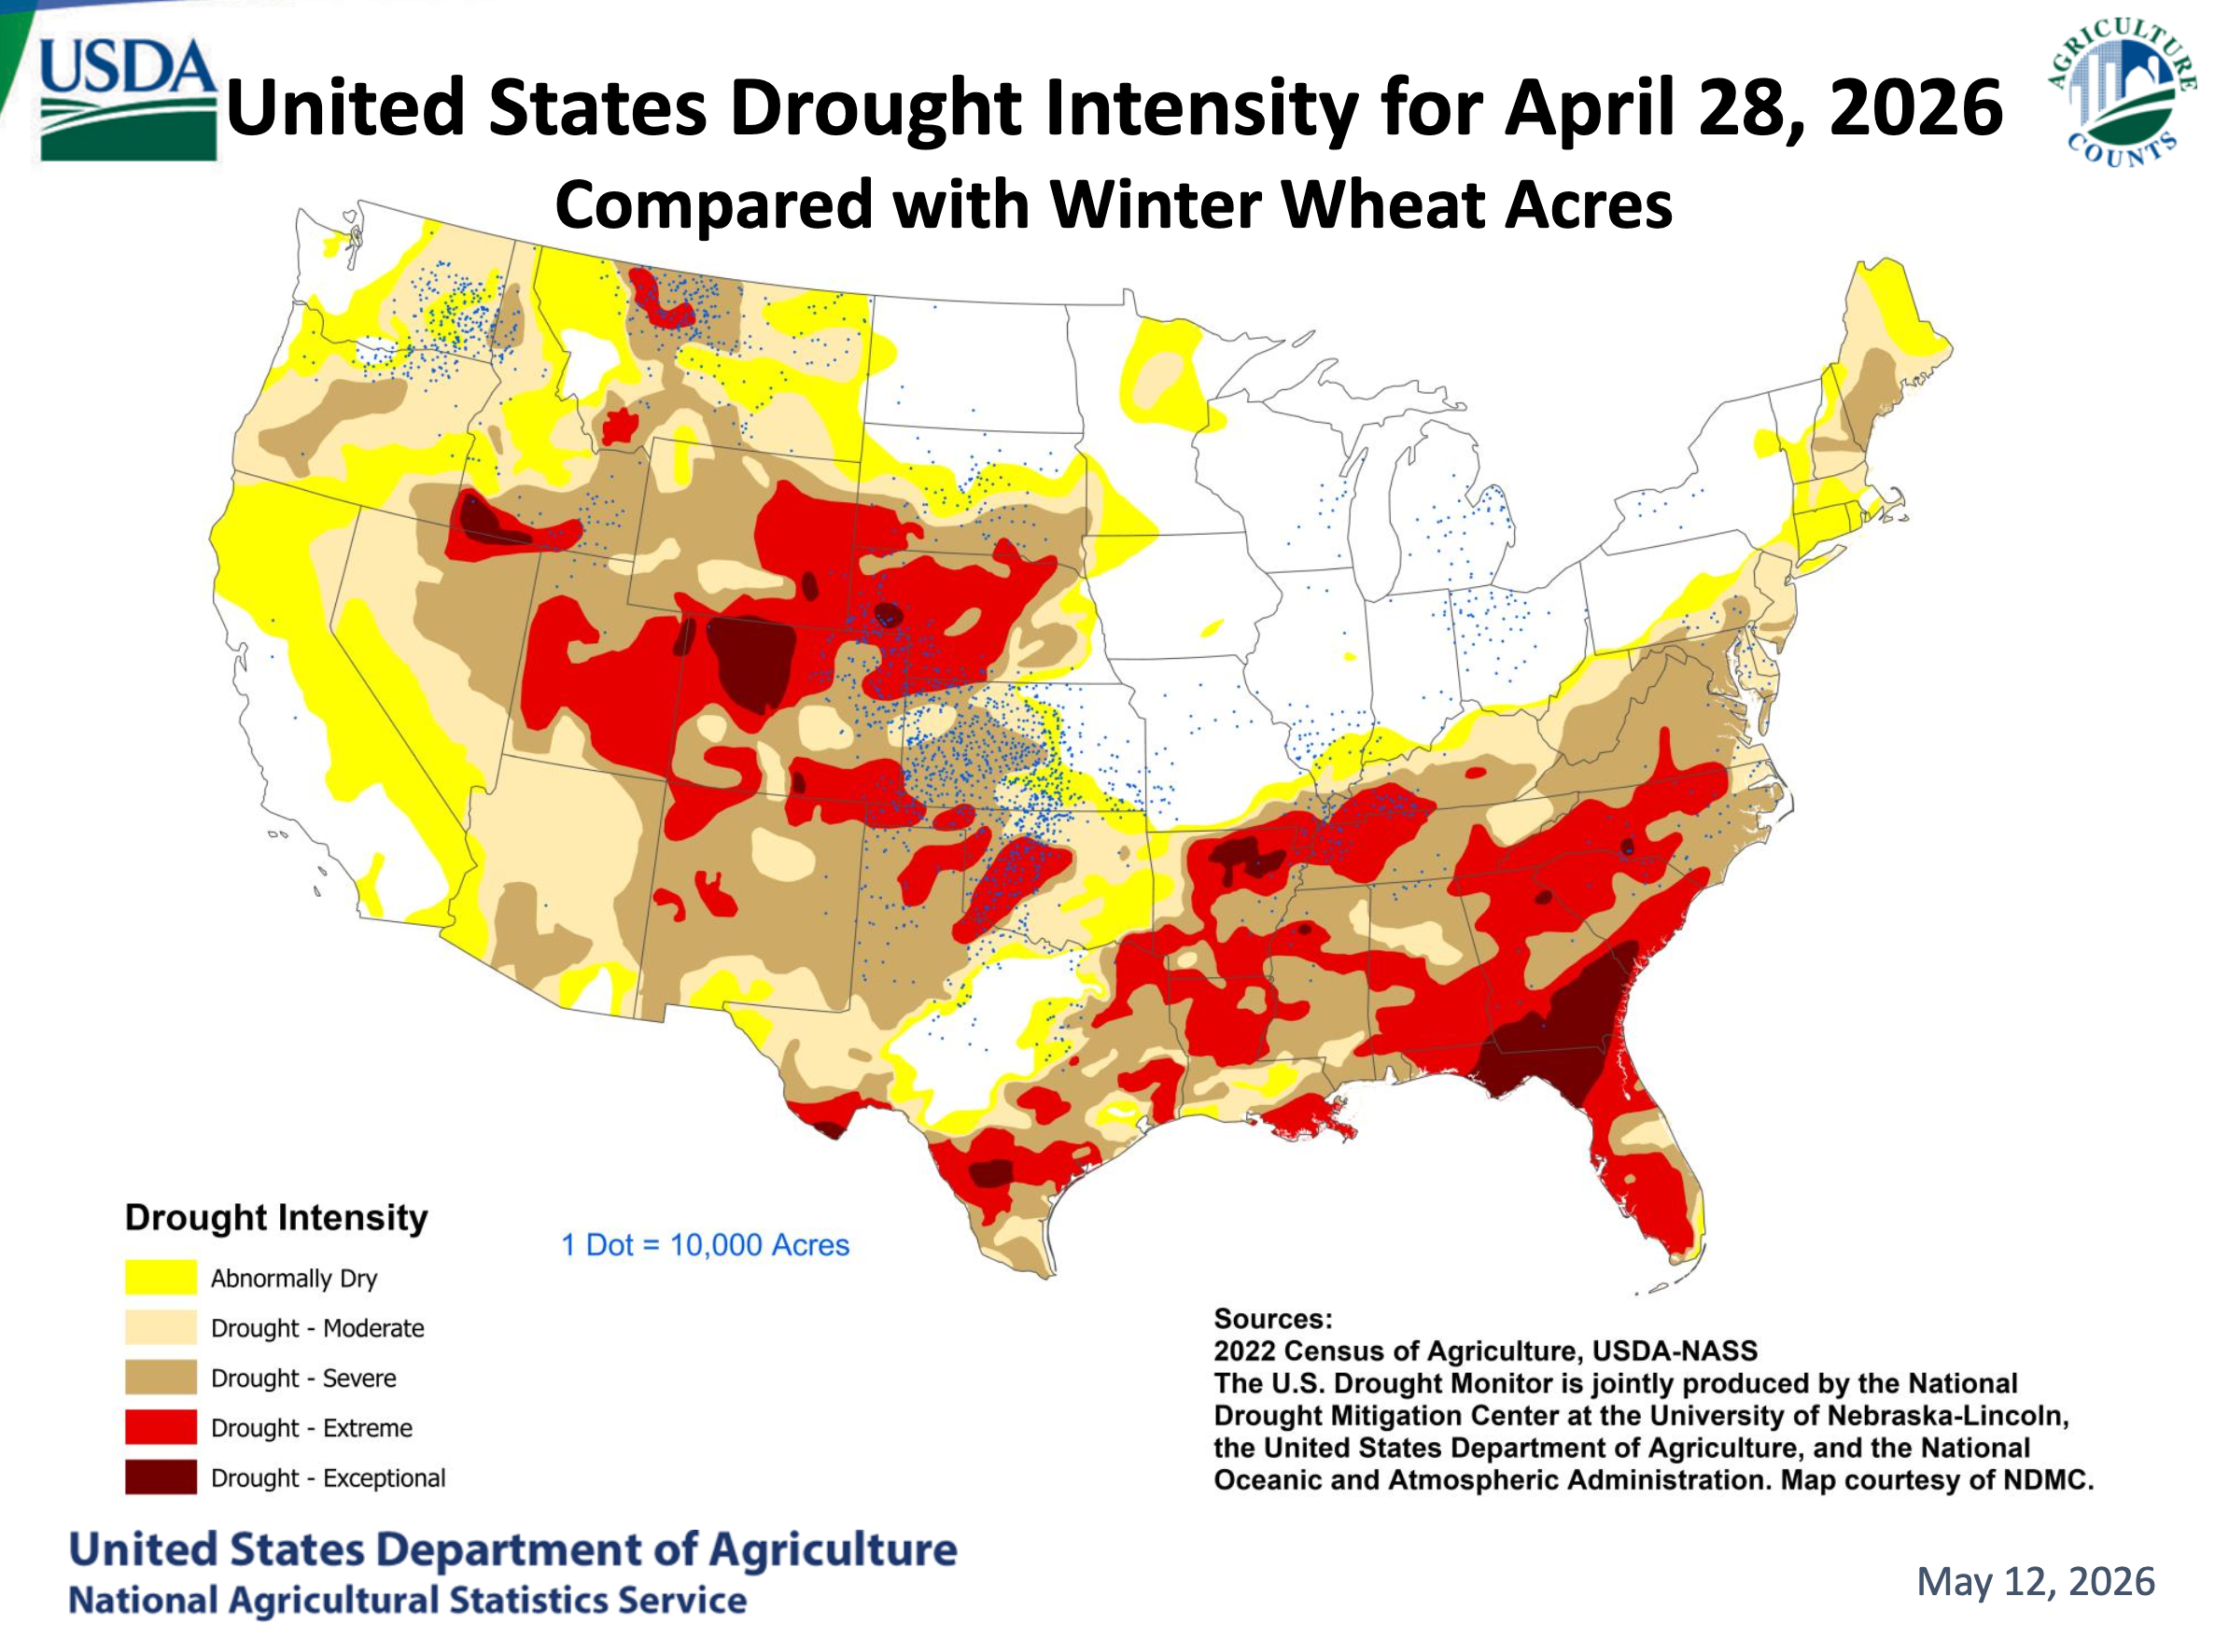
Figure 3. Winter wheat acres in drought. Figure courtesy of the USDA.
Very low dewpoints
The month of May has not only been dry from a lack of precipitation standpoint. The dewpoints also have been unusually low for this late in the spring for much of the north central region (Figure 4). This is mostly a reflection of the dry northerly flow we had earlier in the month, particularly to our east. But no doubt some of this in Nebraska is a lack of surface moisture and lack of healthy, green vegetation.
For those unfamiliar with dewpoint, it is essentially the temperature at which condensation or dew would form. At present, the Harrisburg Mesonet site in the western Panhandle is reporting a temperature of 79°F and a dewpoint of 0°F. That means the air temperature would have to drop to 0°F for condensation. These very low dewpoints have been all too common in this part of the state this spring and the aridity of the air masses have contributed to the worsening drought. The low dewpoints have also been the reason we have seen large diurnal range and a lack of dew in the mornings recently, even when we have had clear skies and calm winds.
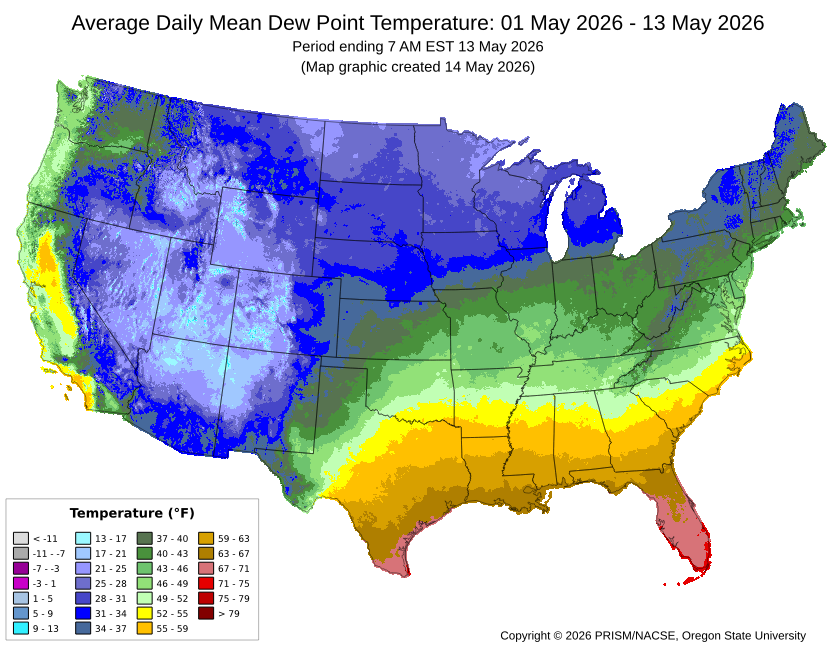
Figure 4. Average dewpoints so far in May according to PRISM


