
Key Points:
Pressure decreases with height.
Temperature generally decreases with height. If temperature increases with height, it is called an inversion.
Meteorologists talk in units of height when referring to the upper air. We also like referring to specific pressure levels like 925 mb, 850 mb, 700 mb, 500 mb, and 200-300 mb.
The colder the atmosphere is, the lower the height of a pressure level will be. Conversely, the warmer the atmosphere is, the higher the height of a pressure level.
The upper left number on the maps below is the temperature in degrees Celsius (remember this is a global cooperative undertaking and the U.S. is an outlier with non-metric units). The bottom number is the dewpoint depression. This is the difference between the air temperature and the dewpoint. The smaller the number the closer to saturation this part of the atmosphere is. The larger the number the drier this part of the atmosphere is. The upper right number is the height of the pressure level in decameters. Multiply by 10 to get the height in meters.
These observations are from weather balloons that are launched around the world at set times during the day.
925 mb: A few minutes after takeoff (in places with elevations under 3,000 feet)
Our first check-in on our journey up is at 925 mb. This is roughly at an atmospheric height of 750 to 800 meters or about 2500 feet above sea level. This is one of the reasons you don't see any observations in much of the western U.S. as they are naturally above this pressure level. At this height, we are mostly interested in determining the temperature, moisture, and wind speed/direction. The temperature at this pressure level in the early morning hours can be an indication of how warm it will be in the afternoon once atmospheric mixing starts. A check from Valley shows it was 31°C (~88°F) at 7 PM CDT on Saturday evening with a dewpoint of 21°C with winds out of the southwest at 25 knots (~29 mph).
We are interested in wind direction and speed too. Faster winds at this level can end up at the surface. Also, seeing wind directions turning with height (called wind shear) is an important ingredient in severe weather.
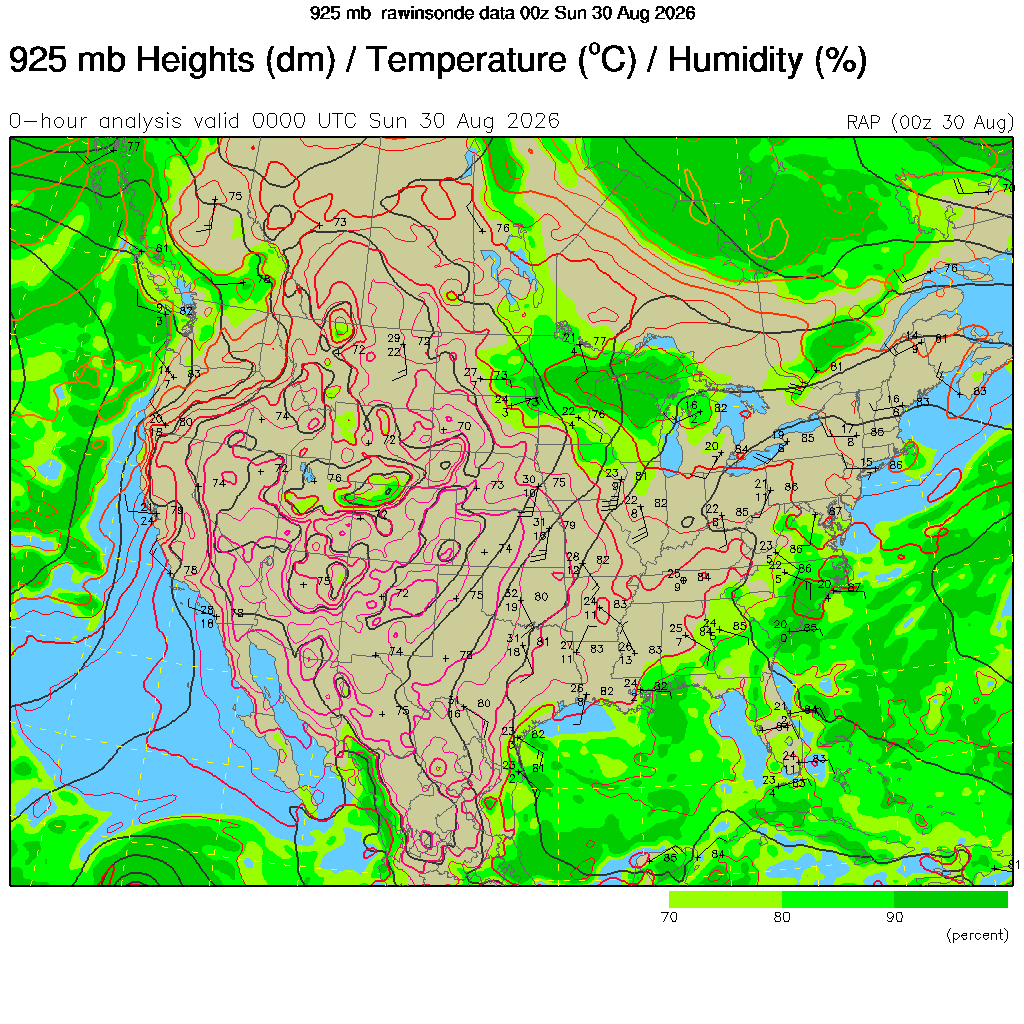
Figure 1. The 925-mb chart from Saturday evening (August 29th)
850 mb: Still climbing up
The next check-in is at 850-mb. At this point we are roughly a mile above the surface. Still not high enough to get up and move around or use electronic devices but we're getting there. At 850 mb we are still interested in temperature and moisture.
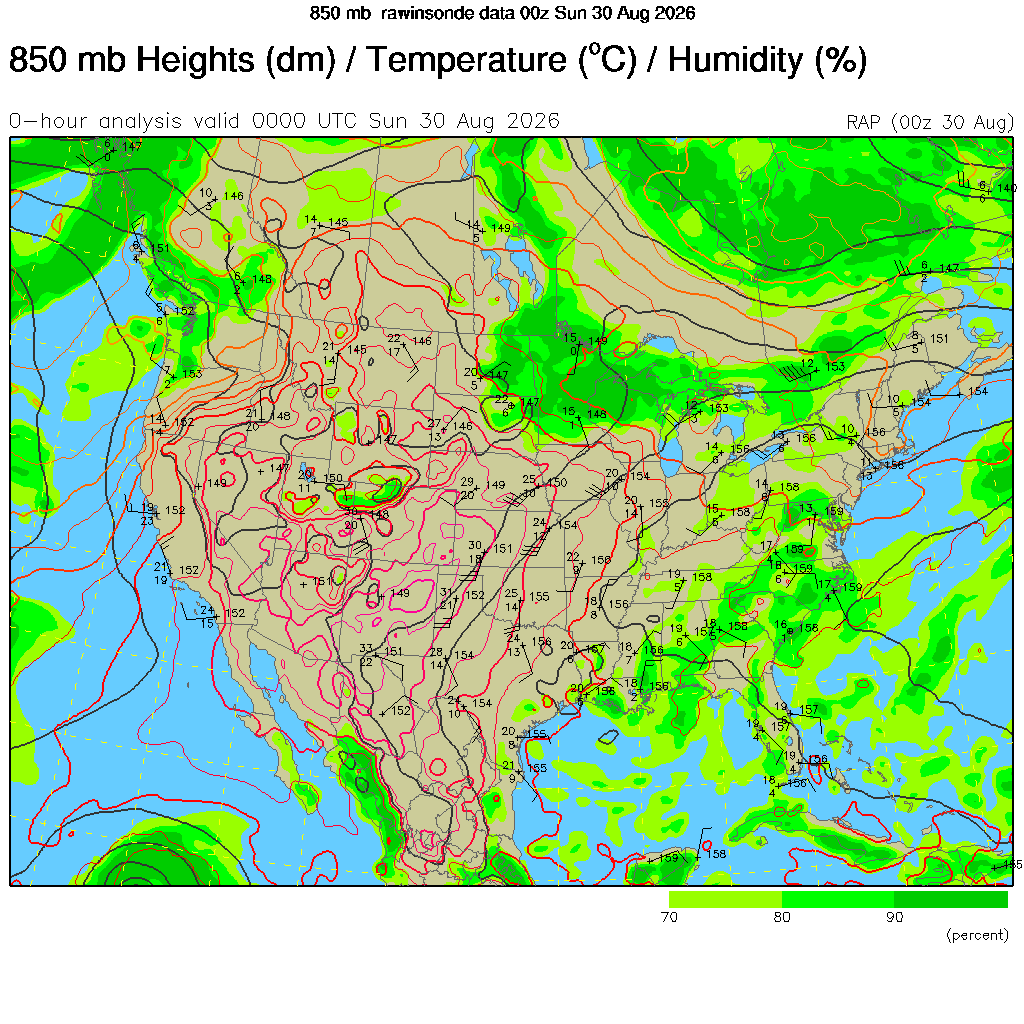
Figure 2. The 850-mb chart from Saturday evening (August 29th)
But at this level we are also very interested in the wind speed (and direction), especially during certain times of the year. Sometimes the winds can get over 100 mph at this level, which would make for a lot of turbulence in the period after takeoff! In the spring and summer, the low-level jet is critical for bringing moisture and helping out with the dynamical environment needed for rain and thunderstorms in the central U.S. This also is important for monsoons (e.g., India) that we will discuss later in the semester. We will also discuss the reasons for the low-level jet and how climate change is affecting them later in the semester.
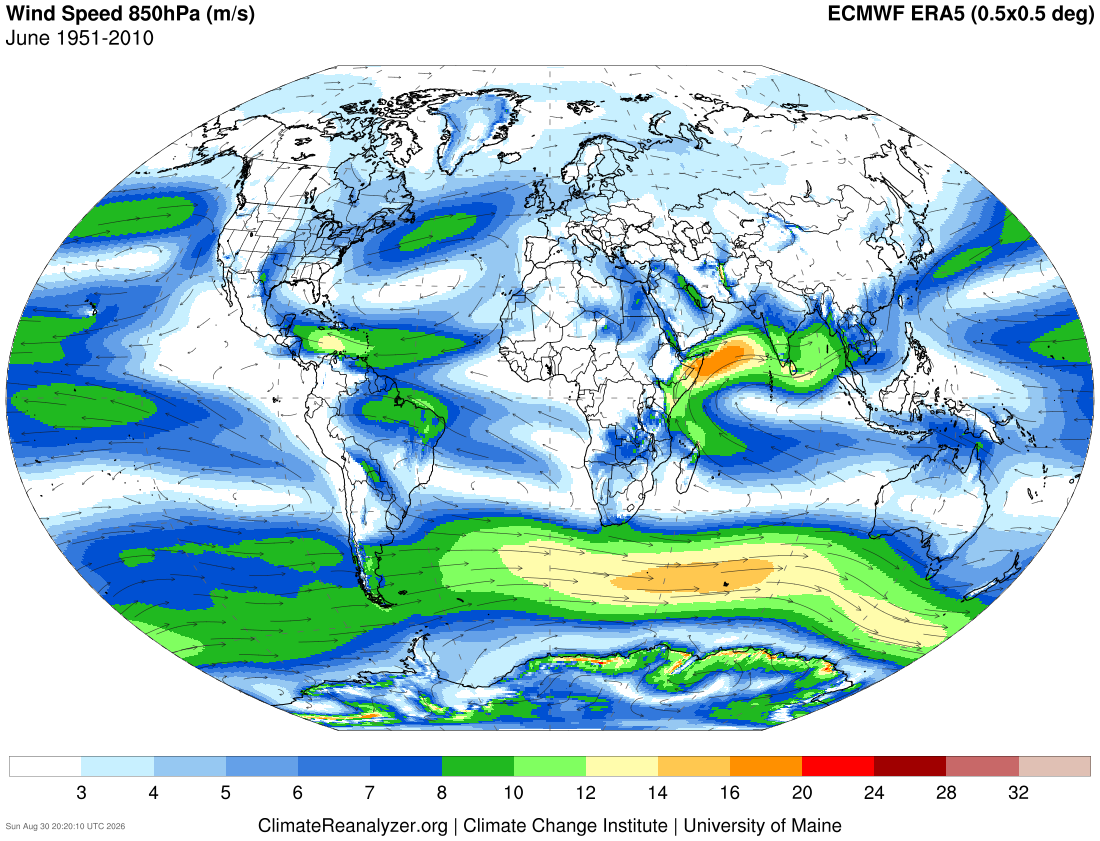
Figure 3. Average wind speed at 850 mb in the month of June
700 mb: You are free to use electronic devices
700 millibars is roughly the height where a flight attendant or captain will tell you it is now safe to use approved electronic devices and to put your tray tables down. We are still
interested in temperature, moisture, and winds.
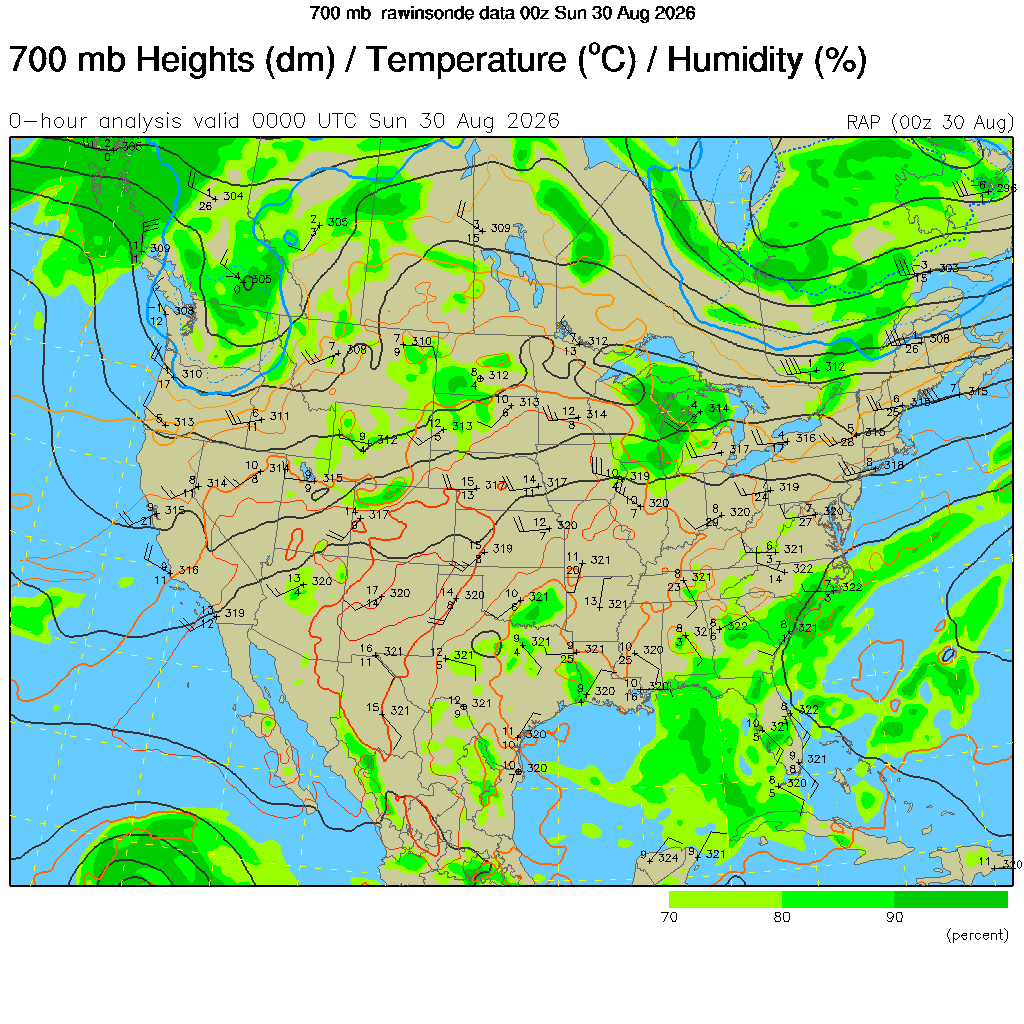
Figure 4. The 700-mb chart from Saturday evening (August 29th)
500 mb: Flight attendants will begin serving drinks
At 500 mb you are at roughly 20,000 feet and assuming no turbulence, the flight attendants are getting ready to start serving drinks. The 500-mb level is probably a meteorologists favorite pressure level. We like looking at this level because of vorticity (which we will talk about later this semester) and because we are trying to identify ridges (high pressure) and troughs (low pressure) that will have a sensible impact on our weather.
We still are interested in temperature and moisture at 500-mb. But what we are most interested in is the height number in the upper right. The lower that number the colder the atmosphere is between the surface and there. The higher that number the warmer the atmosphere is. We are also are very interested in the wind direction and wind speed to determine where the ridges and troughs are and how strong they are. In the map below, the height of the 500-mb level at Valley was 590 dm (5900 meters) and the winds were from the west-northwest at 35 knots. We were on the northern side of a ridge. Quillayute, WA had a height of 569 dm and winds at 40 knots from the north indicating proximity to a trough. We will talk extensively about ridges and troughs later in the semester!
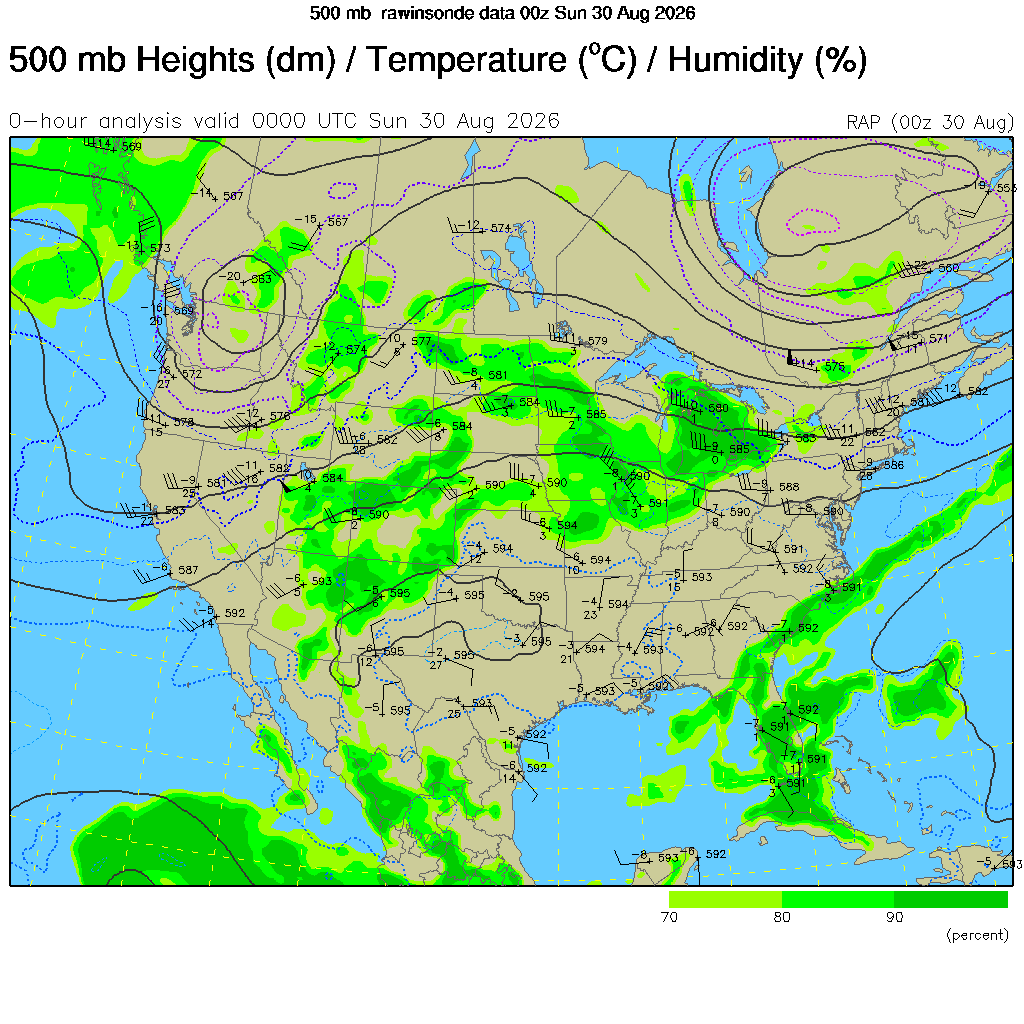
Figure 5. The 500-mb chart from Saturday evening (August 29th)
250-mb: Cruising altitude!
By the time we get up to 250-mb on a flight (assuming it's long enough to get this high!) and the turbulence is not too bad, the flight attendants will be serving stale snacks and lousy coffee. At this point we are somewhere around 30-32 thousand feet in altitude and at the level we know as the jet stream. At this level of the atmosphere, we are very interested in wind speed and direction. Note the prevalence of the black flags in the figure below shows wind speeds well over 50 knots in much of the western and northern U.S. We also are still interested in the height levels (upper right number) to pick out the troughs and ridges.
Depending on where the flight is headed, you may be getting a good tailwind (heading east) or a strong headwind (heading west). Later this semester we will be talking about why this is so. But if you have taken a plane across the U.S., you already know that it takes longer to go west than it does it east. The wind speeds at this level (and at 500-mb) also tend to be stronger (sometimes much stronger) in the winter because of stronger temperature gradients. More on that later this semester too.
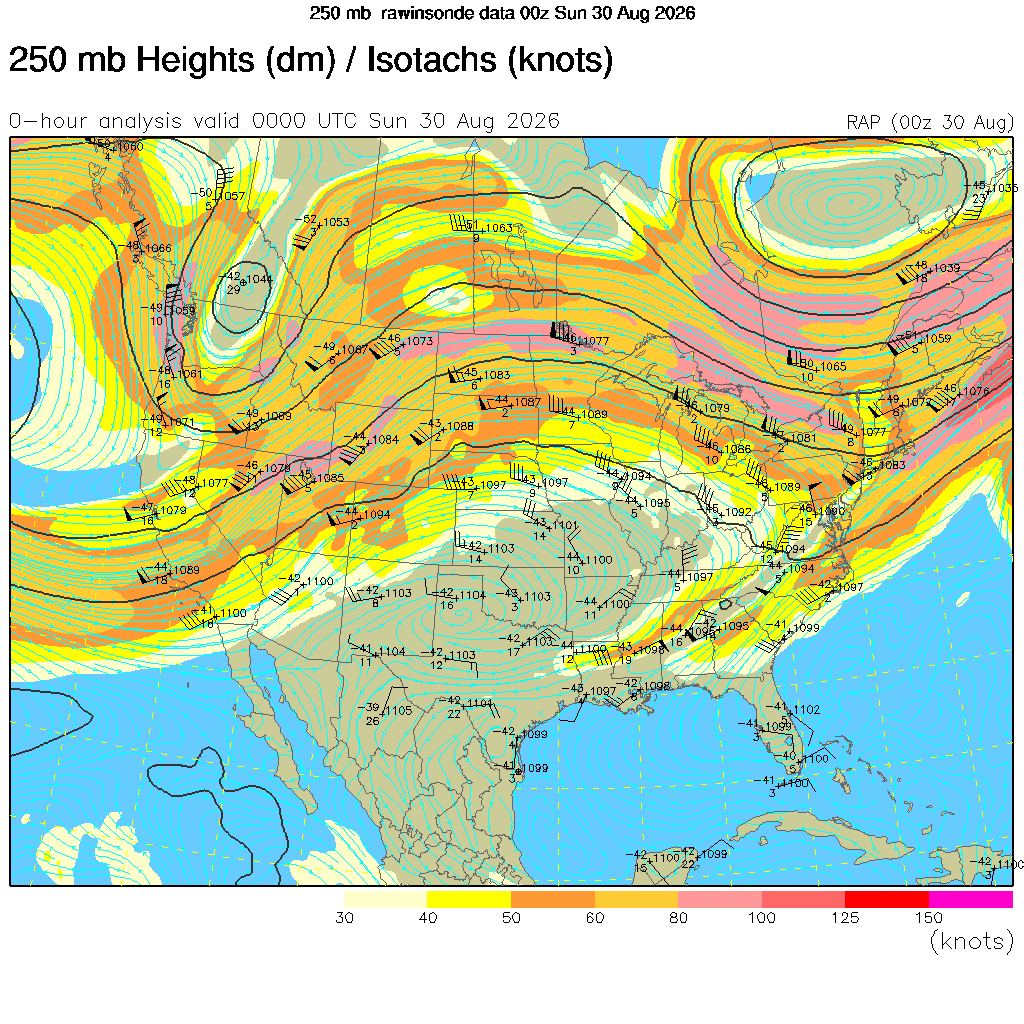
Figure 6. The 250-mb chart from Saturday evening (August 29th)
We have seen a northward shift of the polar jet stream as the planet warms. For example, the winds at 250 mb this past winter in the U.S. had a peak that was several hundred miles further north than in a typical cold winter in the 20th century.
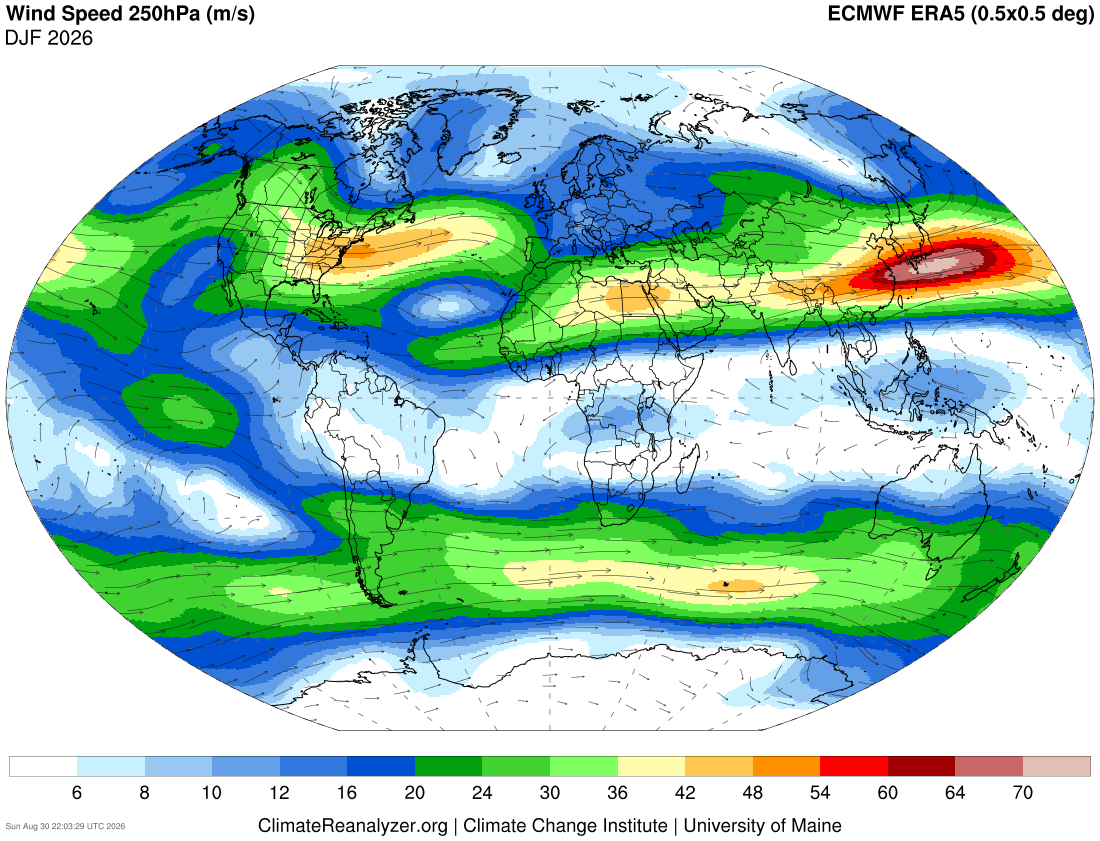
Figure 7. Average 250-mb wind speeds last winter


