Emissivity
Everything with a temperature above absolute zero emits. The warmer the temperature, the shorter the wavelength of emission. Remember that wavelength and energy are inversely proportional.
The Stefan-Boltzman law illustrates this nicely: E = sigma * T4 , where E is the emissivity, sigma is a constant (5.670374419 × 10⁻⁸ W⋅m⁻²⋅K⁻⁴), and T is the temperature in Kelvin.
Balance between the shortwave and the longwave
The sun emits some energy in the ultraviolet (UV) but mostly in the visible spectrum. Blue, green, and red are the main visible bands and have many practical applications for remote sensing. The earth emits in the longwave.
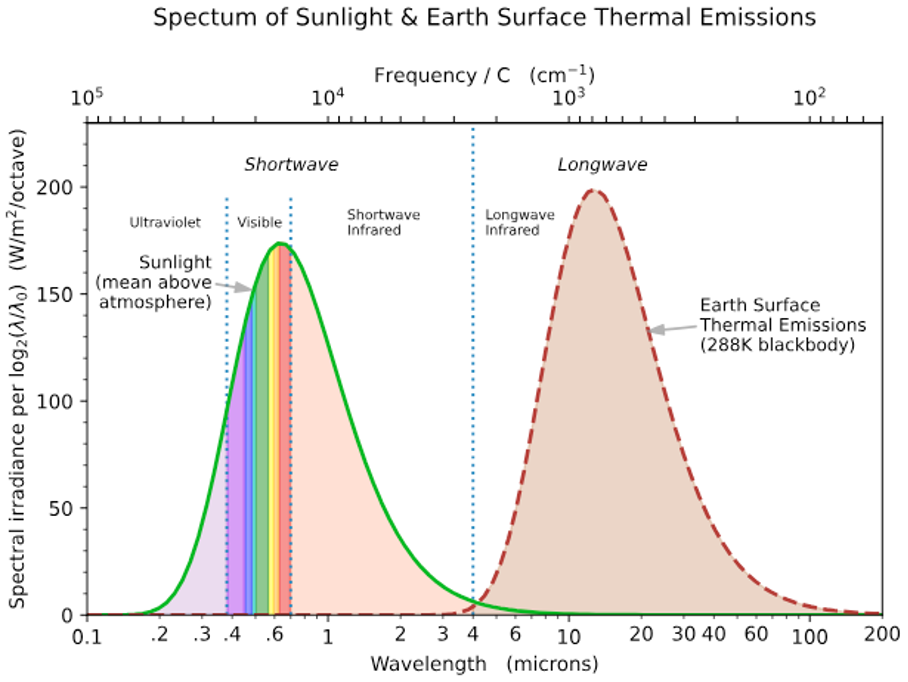
Figure 1. EM Spectrum
Thus, at first glance it may appear that our planet's energy balance is simply a balance between incoming shortwave energy and outgoing longwave. But it's not quite that simple. Some of the incoming shortwave will be reflected by clouds before it even reaches the surface. Some will be reflected away from the surface. This concept of reflection is known as albedo.
White surfaces will have a much higher albedo (0.7-0.9, representing 70 to 90 percent) than a dark surface. Thus, snow has a much higher albedo than a parking lot. The loss of snow and ice cover in the polar regions therefore accelerates warming in a process known as a positive feedback.
So, we have determined that not all of the incoming shortwave energy is used. Does all of the longwave energy escape? Well, no. The greenhouse gases (water vapor, carbon dioxide, methane, etc...) all absorb well in different areas of the longwave portion of the spectrum and act as a blanket.
Figure 2 demonstrates this whole balance between shortwave (yellow arrows) and longwave energy (orange arrows). So now we can write the net radiation equation: Rn = (1- albedo)* incoming shortwave - (outgoing longwave + incoming longwave). The higher the greenhouse gas concentration the larger the overall net radiation. Thus, when you read about the shared socioeconomic pathway and see numbers like 2.6 Wm-2 or 8.5 Wm-2, that represents the increased net radiation we are getting because of an enhanced greenhouse effect. We could also achieve this increase in net radiation with increased shortwave energy from the sun and later this semester we will discuss how this naturally happens over the course of thousands of years.

Figure 2. Explanation of the net radiation balance
Once we have the net radiation, how it is partitioned matters greatly. Some of the energy will go in as a ground flux (G). But most of the energy will go into heating surfaces. If it is dry, more of that will go into sensible heat (H), which essentially means that there has been a transfer of energy without any change of state. Think of it as the heat you feel on a hot day over a warm surface. If it is wet, more will go into latent heat (LE), which does require a state change of energy from water to water vapor. Areas that have more vegetation and water, have much higher LE than H and areas with little to no moisture have much higher levels of H than LE.
We can write the energy balance as follows:
Net Radiation= G + LE + H
though it is often written as Rn - G = LE + H.
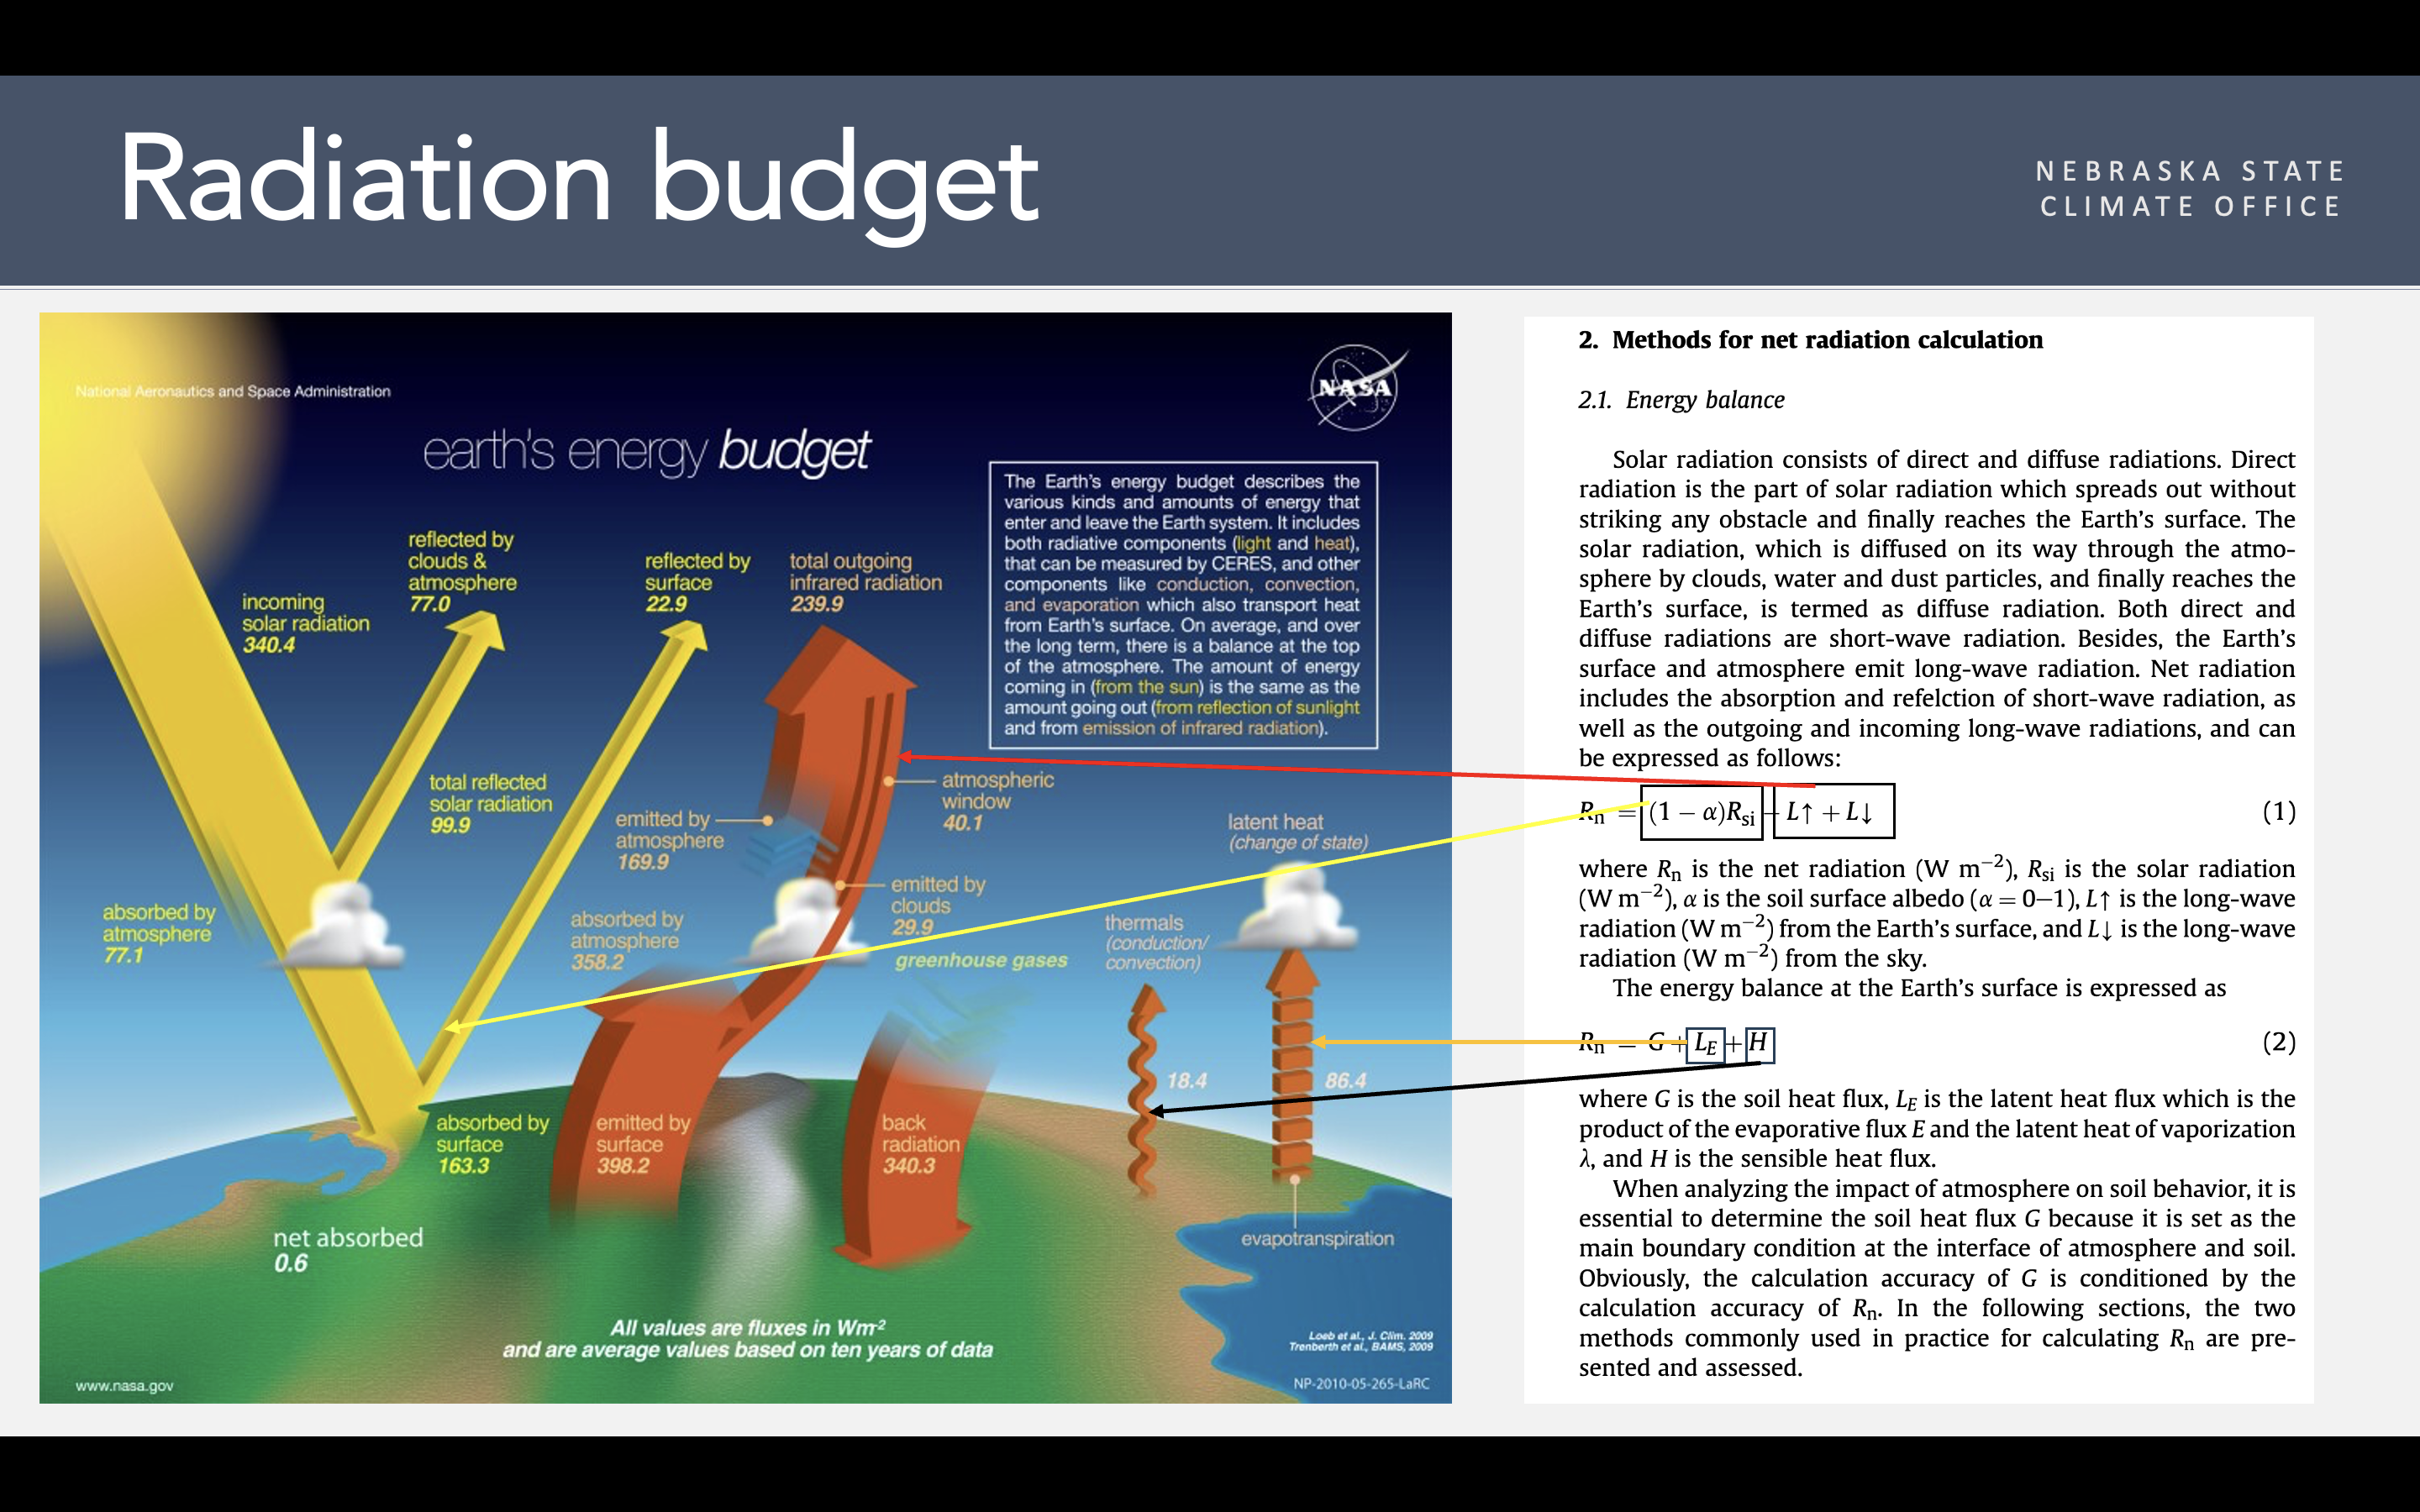
Figure 3. Additional explanation of Earth's energy balance
There are useful products out there that can show us the accumulated shortwave energy from the sun, like in Figure 4.

Figure 4. Daily solar shortwave energy
We also can measure how much is leaving via outgoing longwave, like in Figure 5.

Figure 5. Outgoing longwave energy and its anomalies over the last 30 days.


