Heat returns
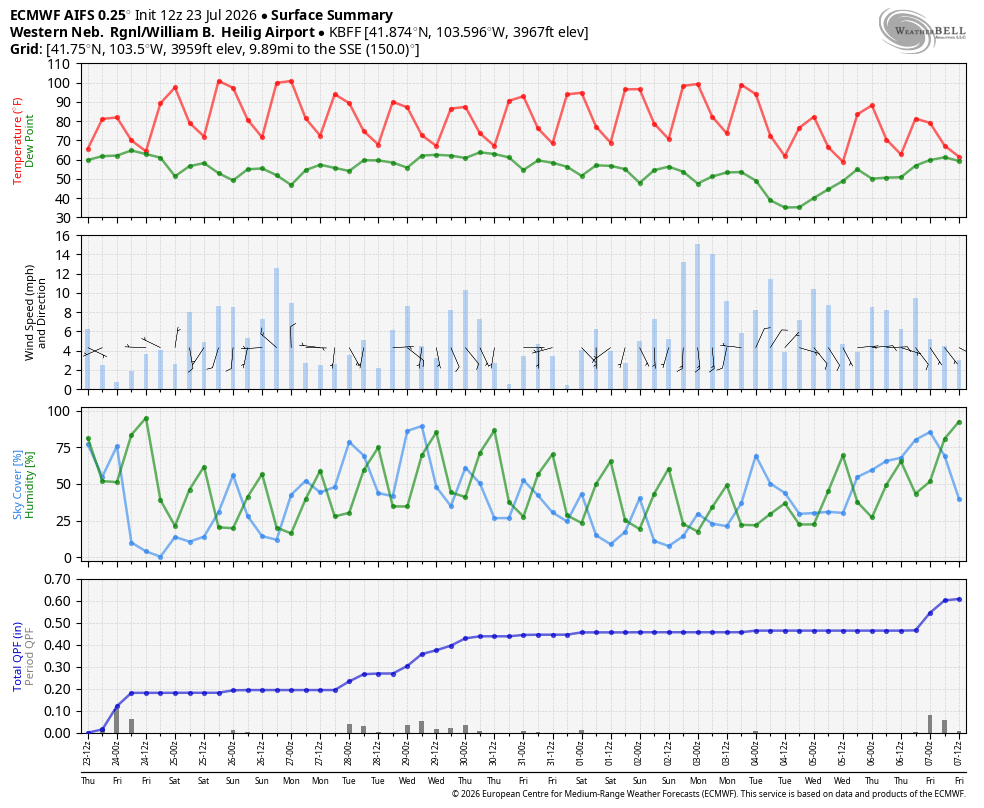
The break in the heat that most of us have had the past few days is going to end on Saturday as the upper-level ridge builds back to the north and east. Temperatures will be in the 90's for all but the far east on Saturday with temperatures getting over 100°F common in the Panhandle and parts of southwest Nebraska. Sunday may be the peak of the heat with highs in the mid 90's in eastern Nebraska, 97-102°F in central Nebraska, and 101-108°F in western Nebraska. Some areas around Chadron may flirt with 110°F.

Figure 1. Projected 500-mb height anomalies on Sunday afternoon
Dew points will be in the 70's in south central Nebraska and northeast Nebraska and likely well into the 70's on Sunday afternoon in the southeastern section of the state.
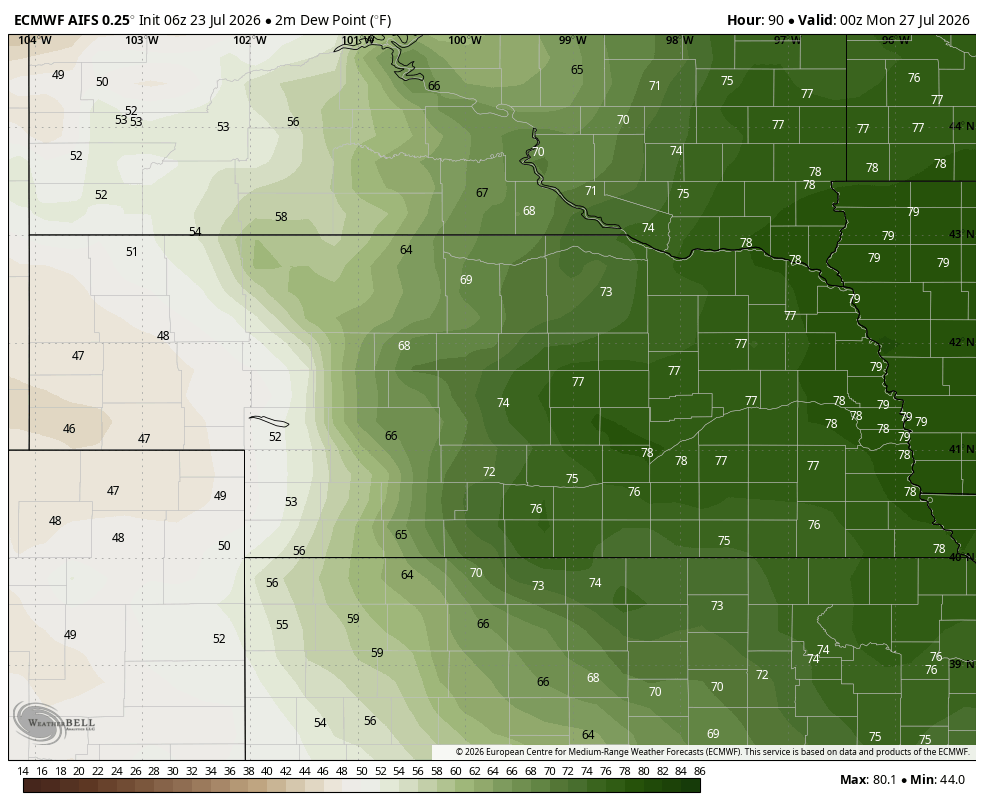
Figure 2. Projected dew points on Sunday afternoon according to the ECMWF AI model
Heat advisory criteria will likely be met statewide and an excessive heat warning may be warranted along the Missouri River where heat index values may approach 110-115°F.
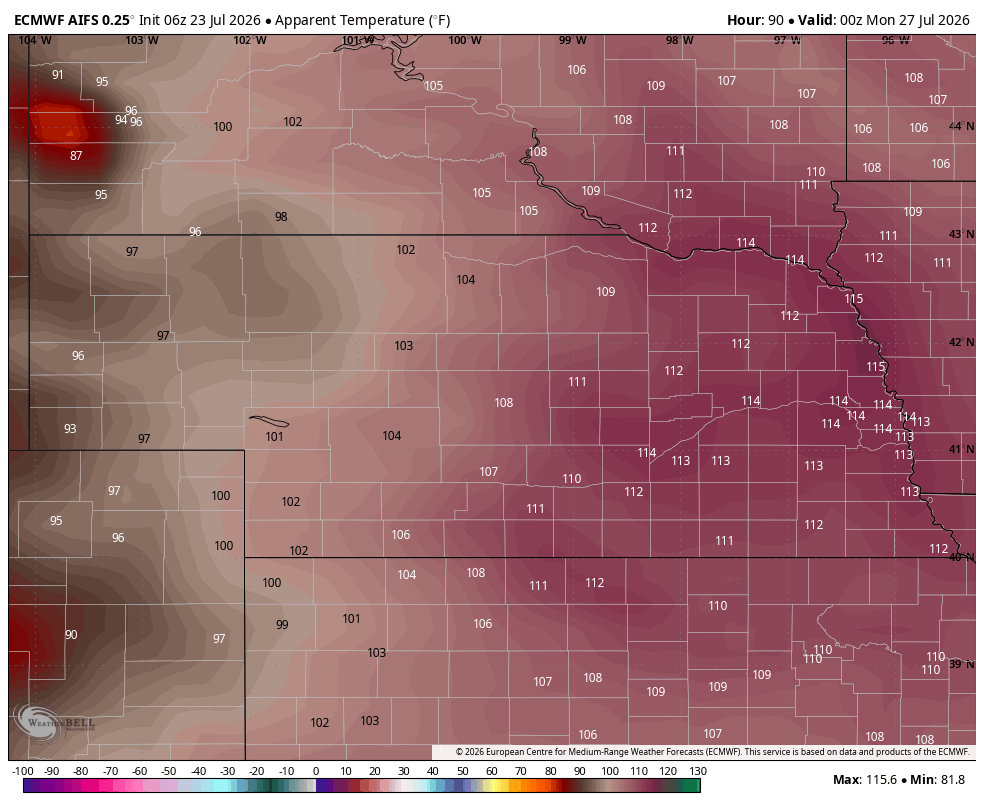
Figure 3. Potential heat index values on Sunday afternoon
Temperatures will remain hot on Monday but may be slightly better in western and northern sections of the state. Temperatures start to cool off a bit on Tuesday and will be around seasonal levels between Wednesday and Friday. High temperatures may be cooler than projected at times if there is more cloud cover and/or rainfall during the daytime hours.
Rain chances
No rain is likely anywhere in the state between Friday night and Monday evening. But as the ridge starts to weaken slightly and shift back toward the south, chances of moisture will start to return as soon as Monday night in western Nebraska and Tuesday elsewhere. The position of the upper level ridge and surface high pressure over northern Mexico is favorable for a very active monsoon in the southwest and that moisture is expected to come up and around the ridge. This will mean chances for showers and storms from the Front Range to the Western Corn Belt on a regular basis next week.
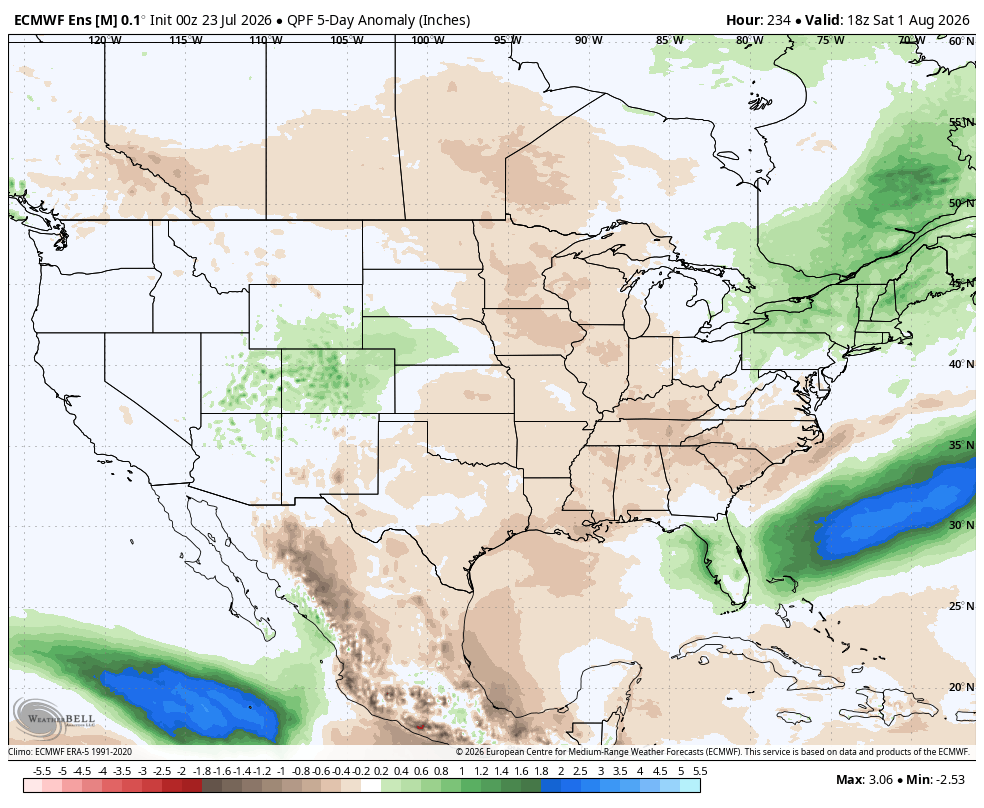
Figure 4. Projected precipitation anomalies next week
Best chances of significant precipitation next week are in western Nebraska, which would be great for drought relief. But it is probable that some complexes of storms cross the state between Monday night and Friday, so central and eastern sections of the state are going to have periodic chances of rain and storms next week. Exactly where and how much is difficult to pinpoint but some places in central and eastern Nebraska may be surprised by how much rain falls next week. This would be very beneficial for those areas that have largely been missing out on better moisture since Father's Day. A look ahead deeper in the crystal ball shows chances of some cooler weather coming back after the first weekend in August. That also would be welcome news.
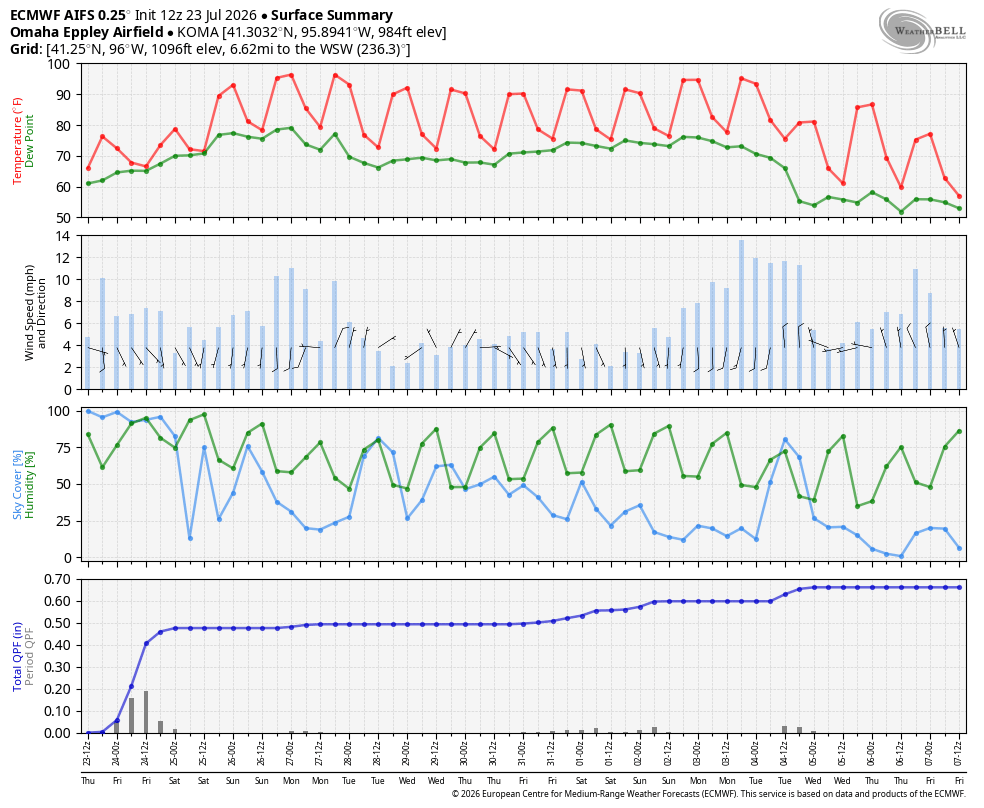
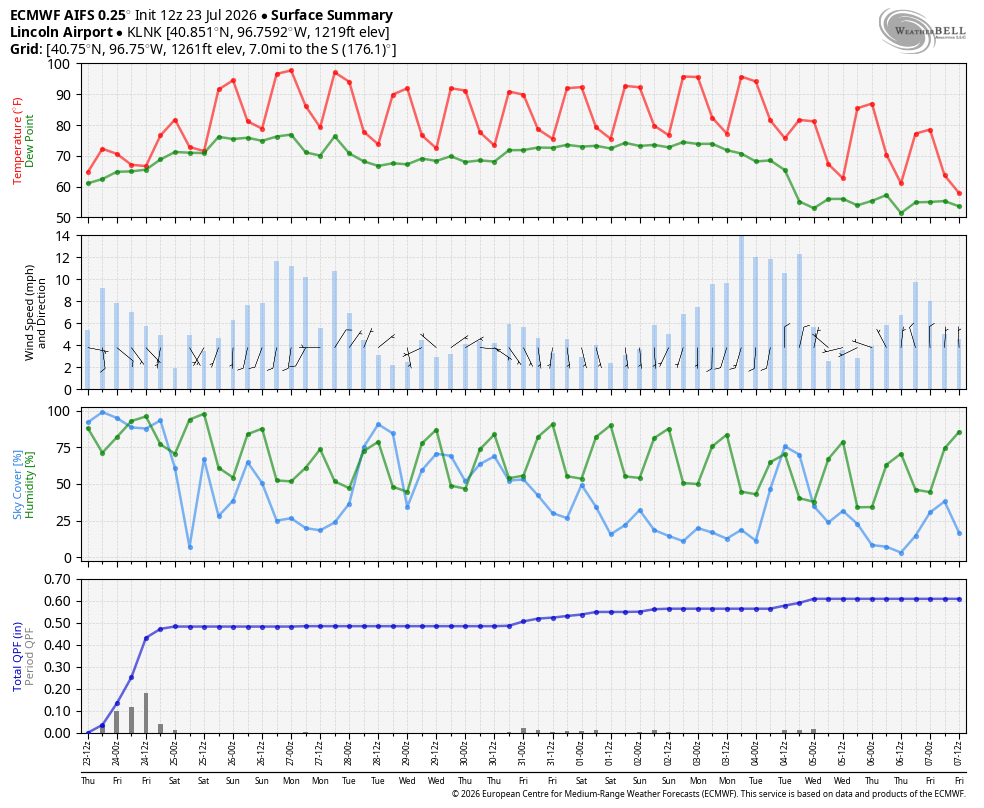
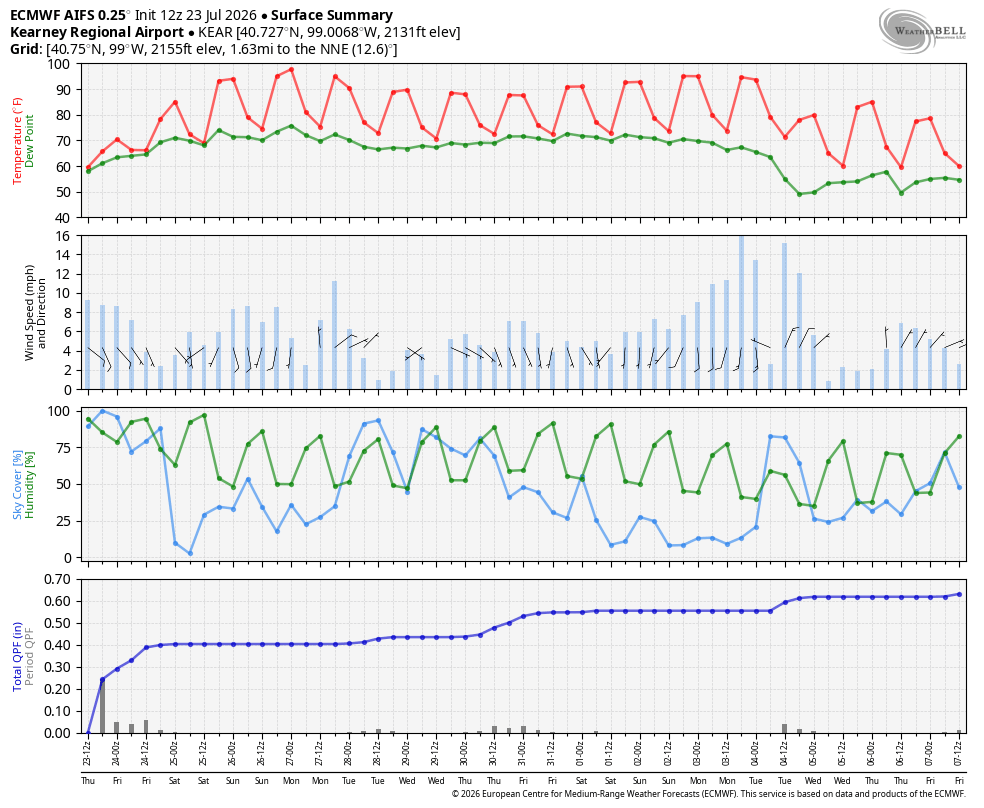
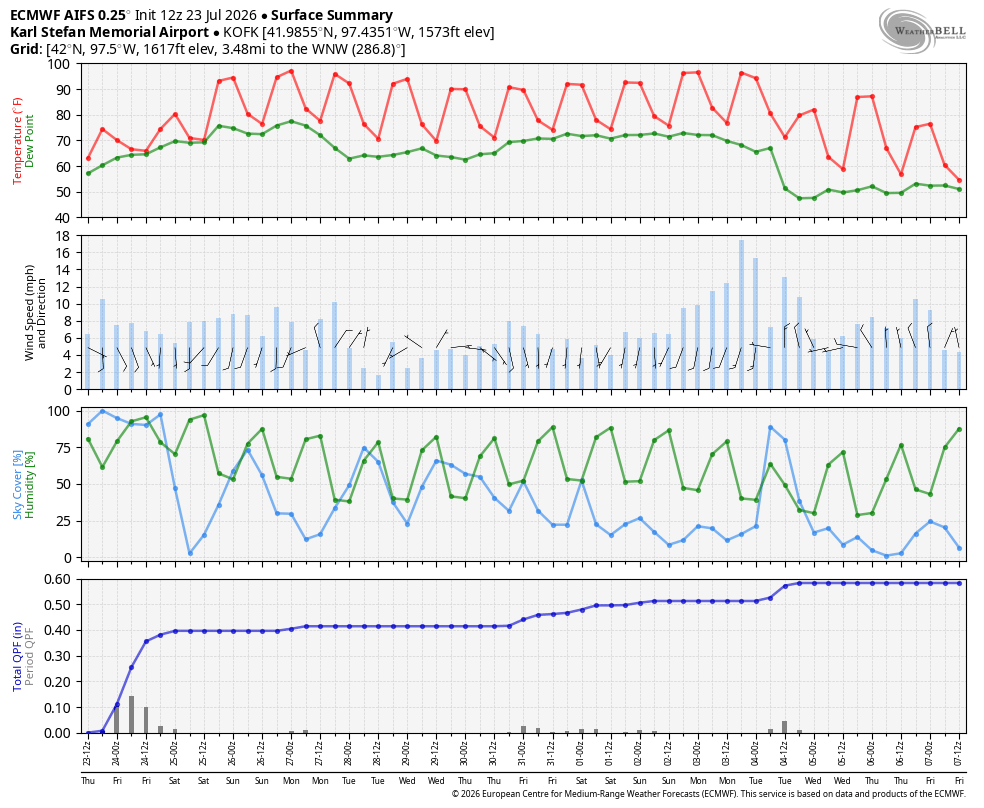
Forecast Meteograms
Omaha:
Lincoln:
Kearney:
Norfolk:
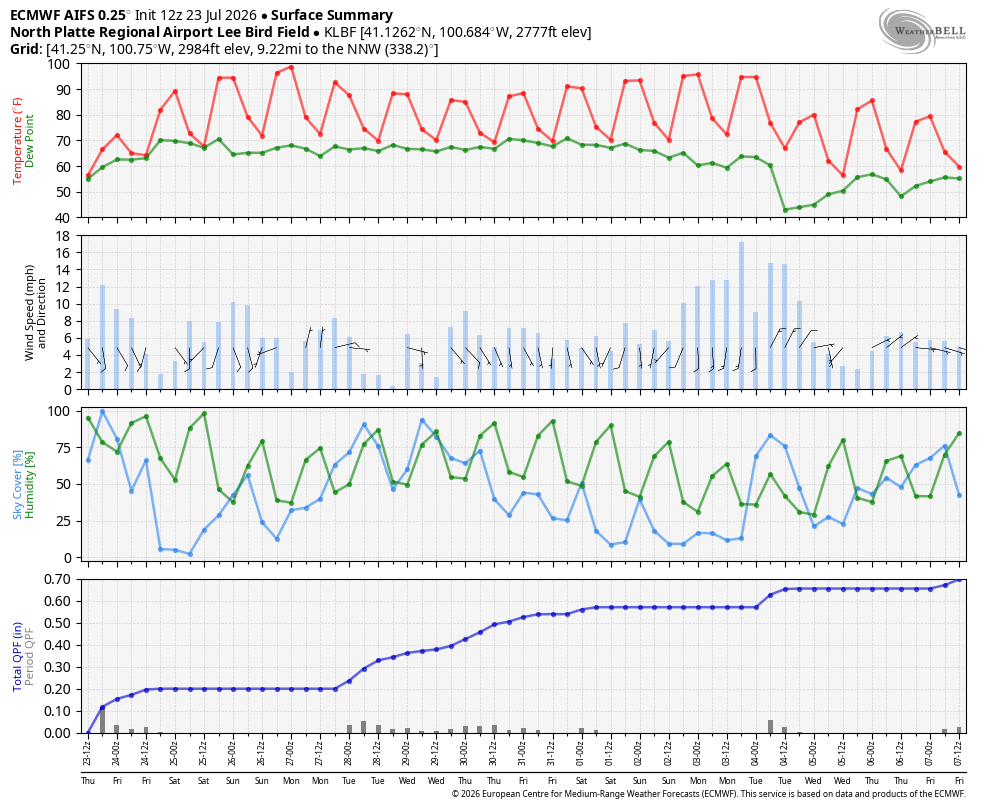
North Platte:
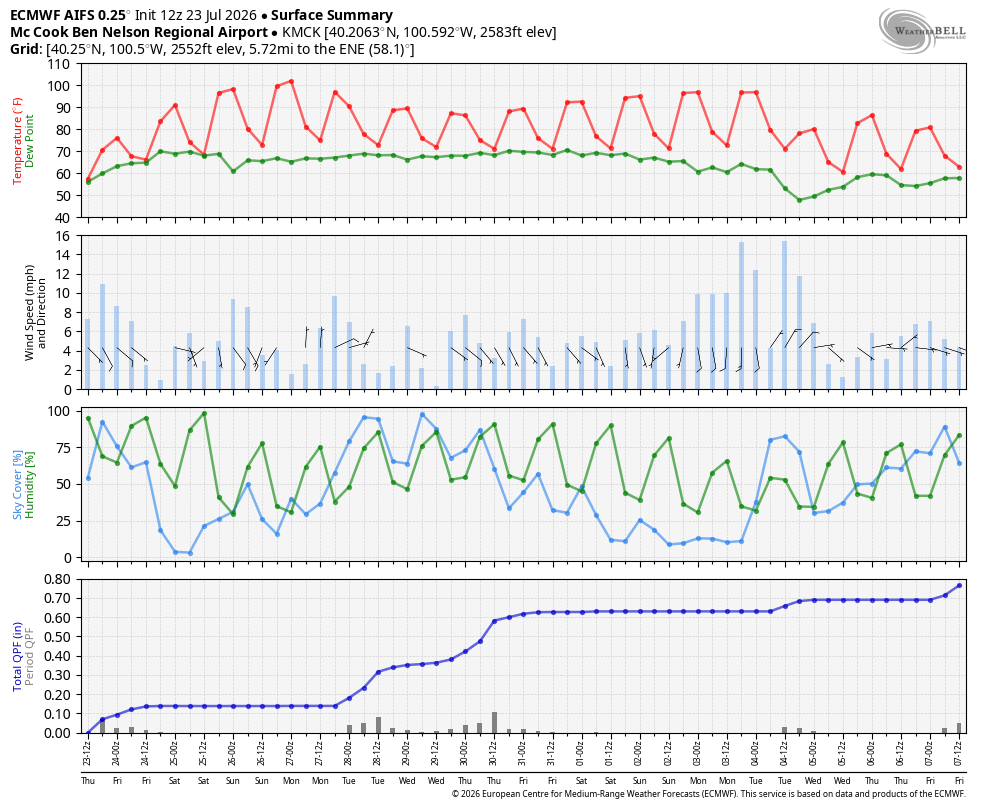
McCook:
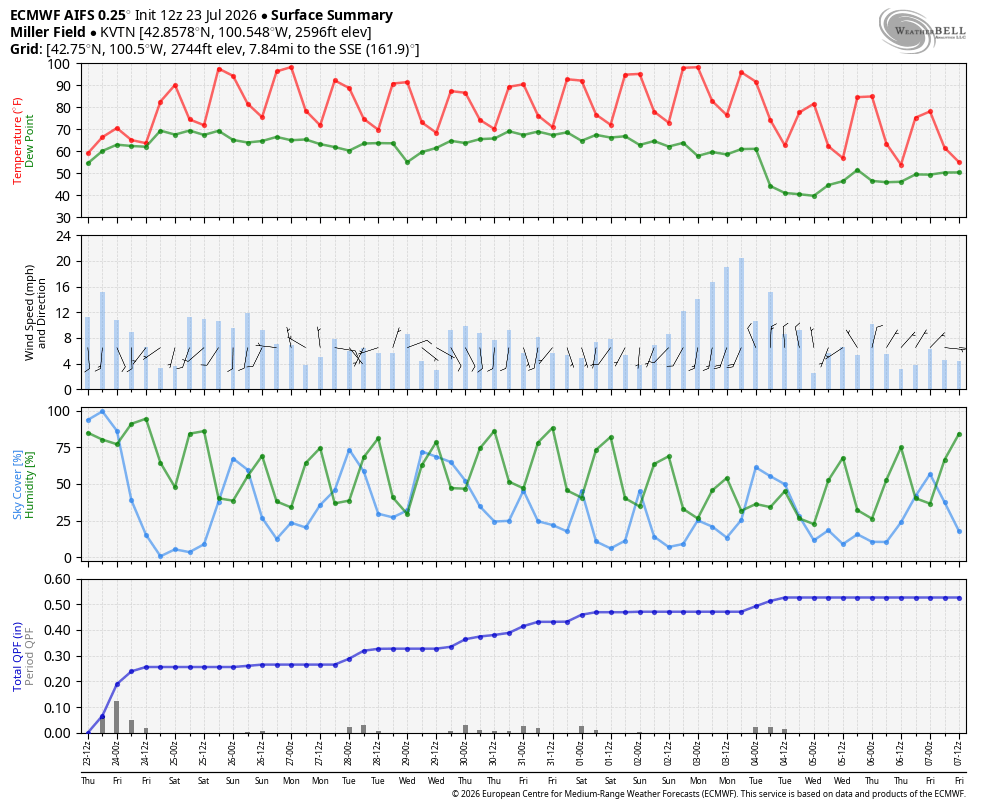
Valentine:
Scottsbluff: