
A funny name
The name Skew-T log-P sounds like it should be the name of a band or a mystery dish at a restaurant. And maybe those exist! In this case though we are talking about a diagram that gives a ton of information about the atmosphere. These are obtained from the weather balloons that are released at locations around the globe. The name comes from the temperature and pressure lines. The former is slanted up and toward the right (skew-T; solid green lines skewed right called isotherms) and the latter is logarithmically related to height (log-P; solid horizontal lines at different pressure levels called isobars).

Figure 1. A skew-T log P figure without any observational data
What are the other crazy lines?
Let's take a look at what all these lines mean and we will start with the temperature and pressure lines. Lines of constant pressure are called isobars and lines of constant temperature are called isotherms.
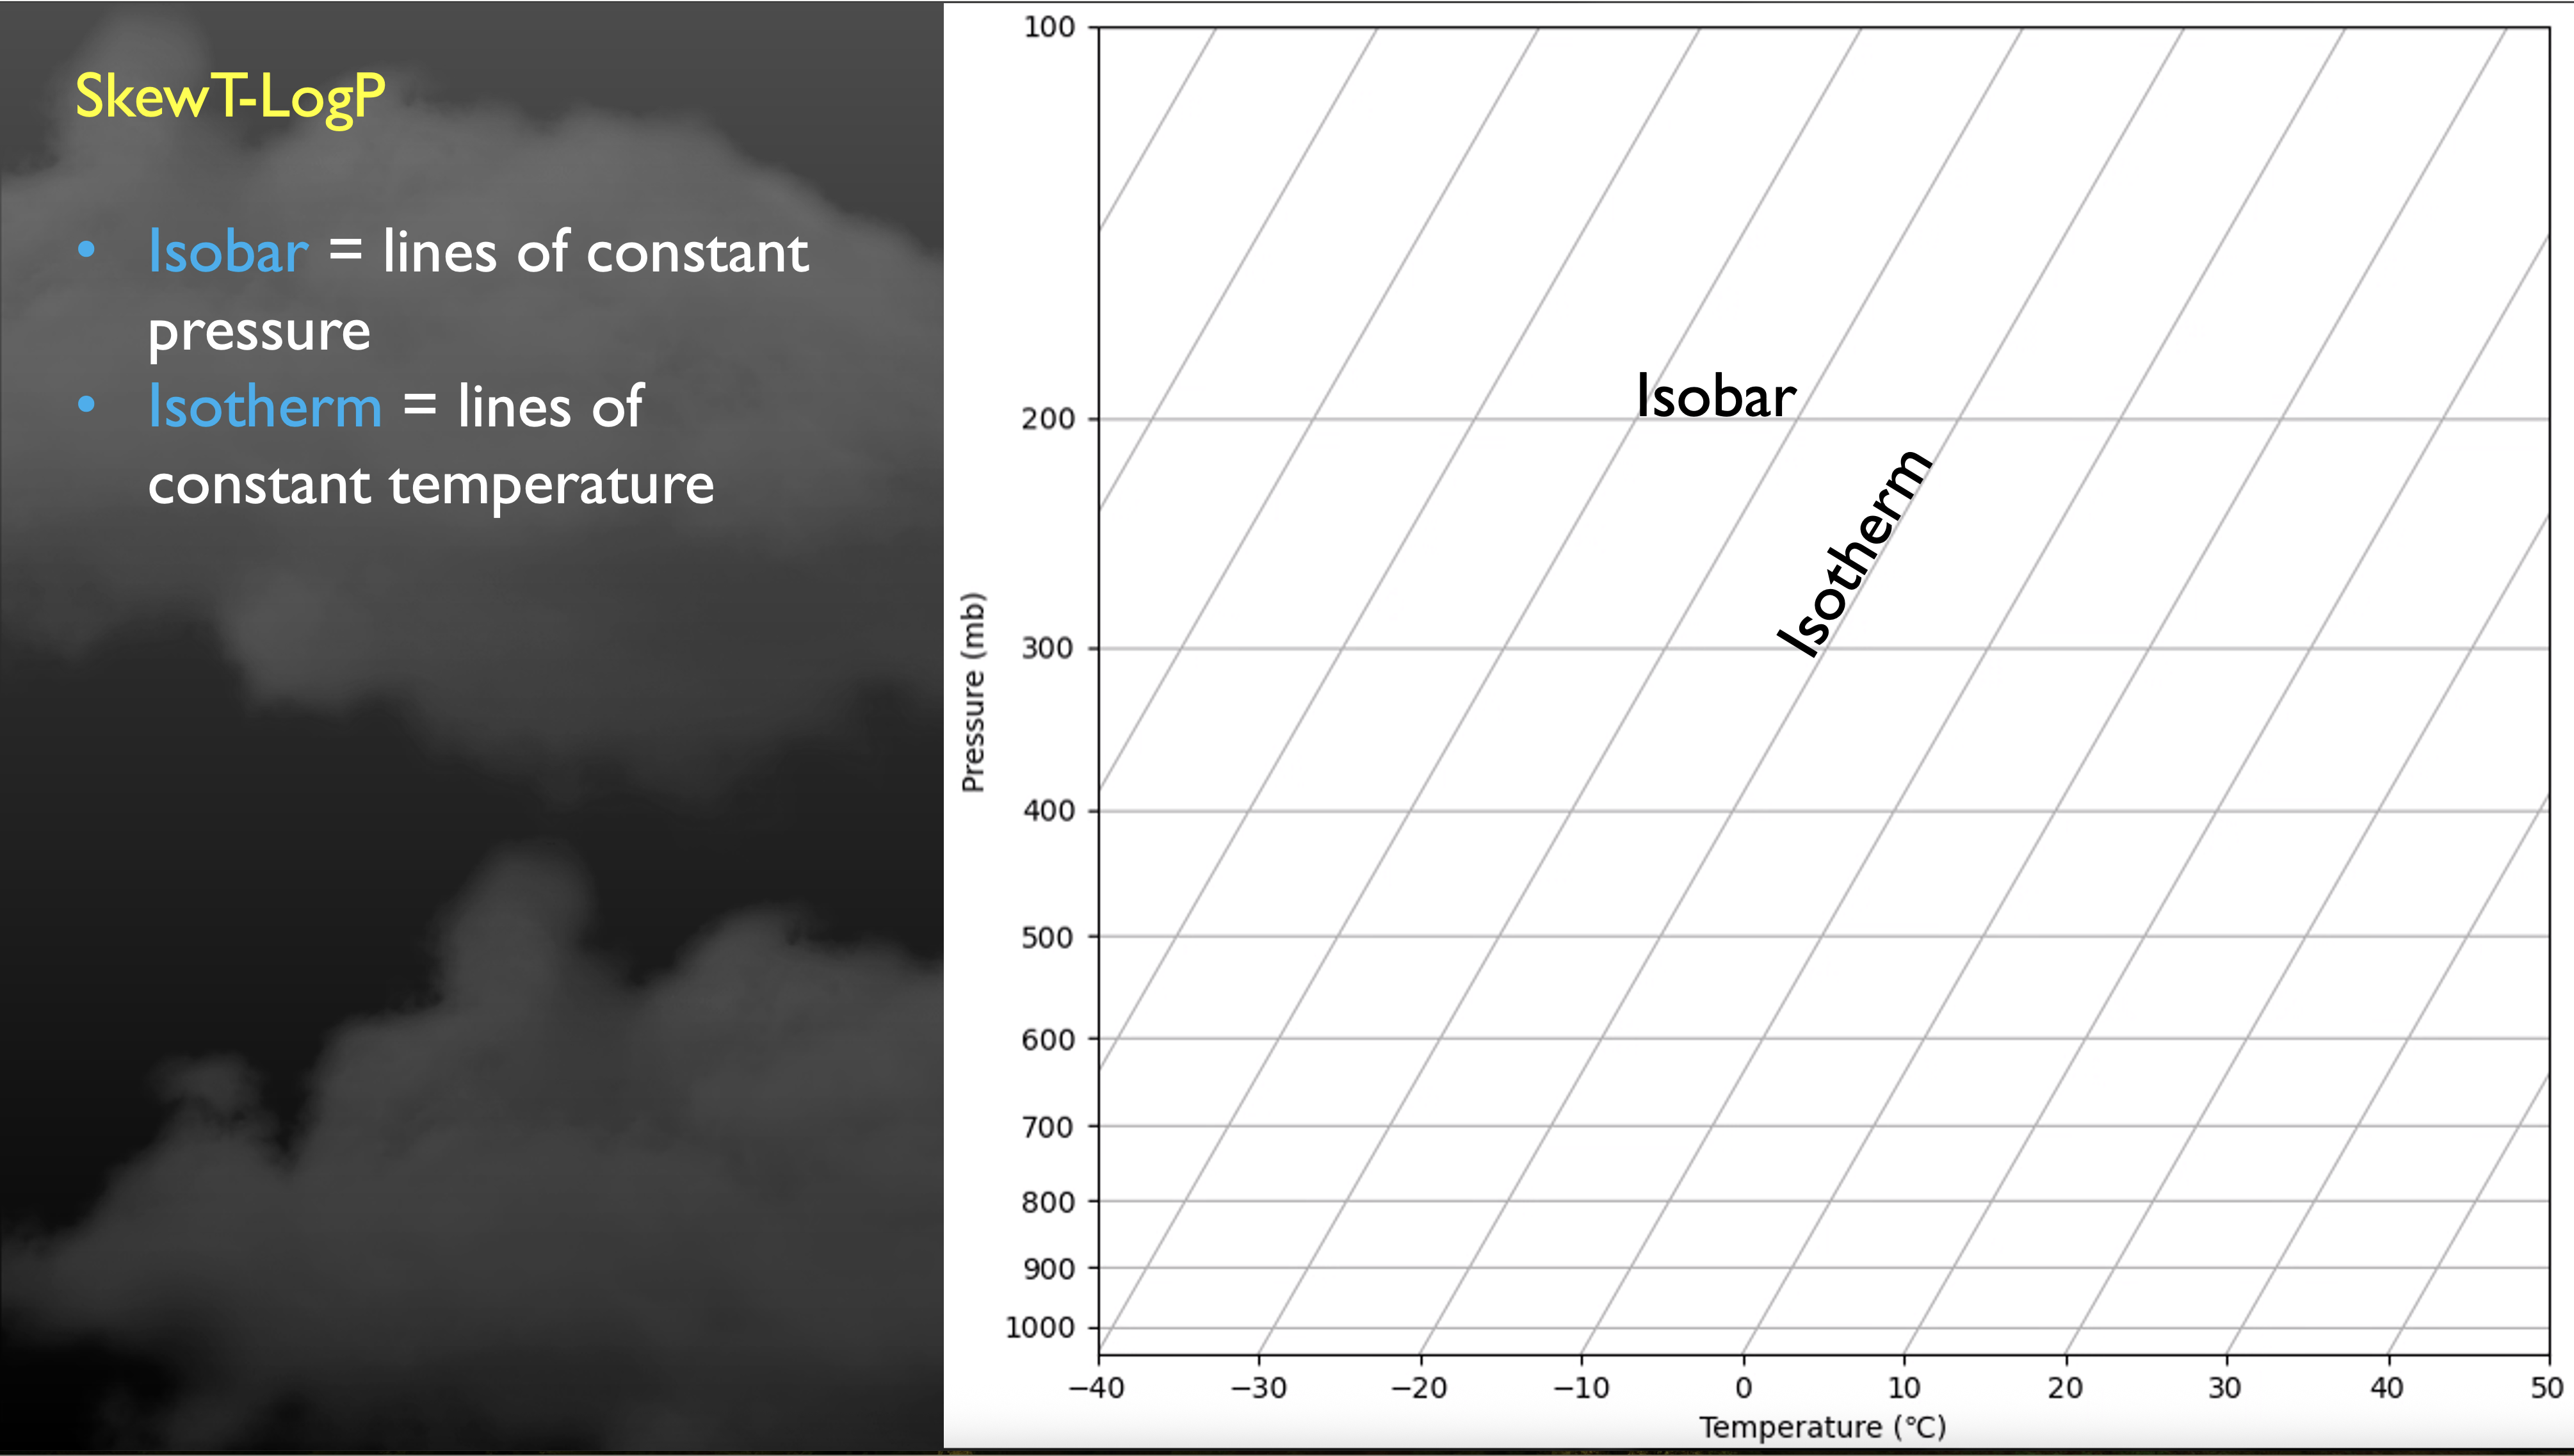
Figure 2. Isotherms and isobars isolated
Next let's take a look at how air cools with height (lapse rate). We call these lines adiabats. The dry adiabatic lapse rate is how an unsaturated air parcel will cool and the moist adiabatic lapse rate is how a saturated air parcel will cool.
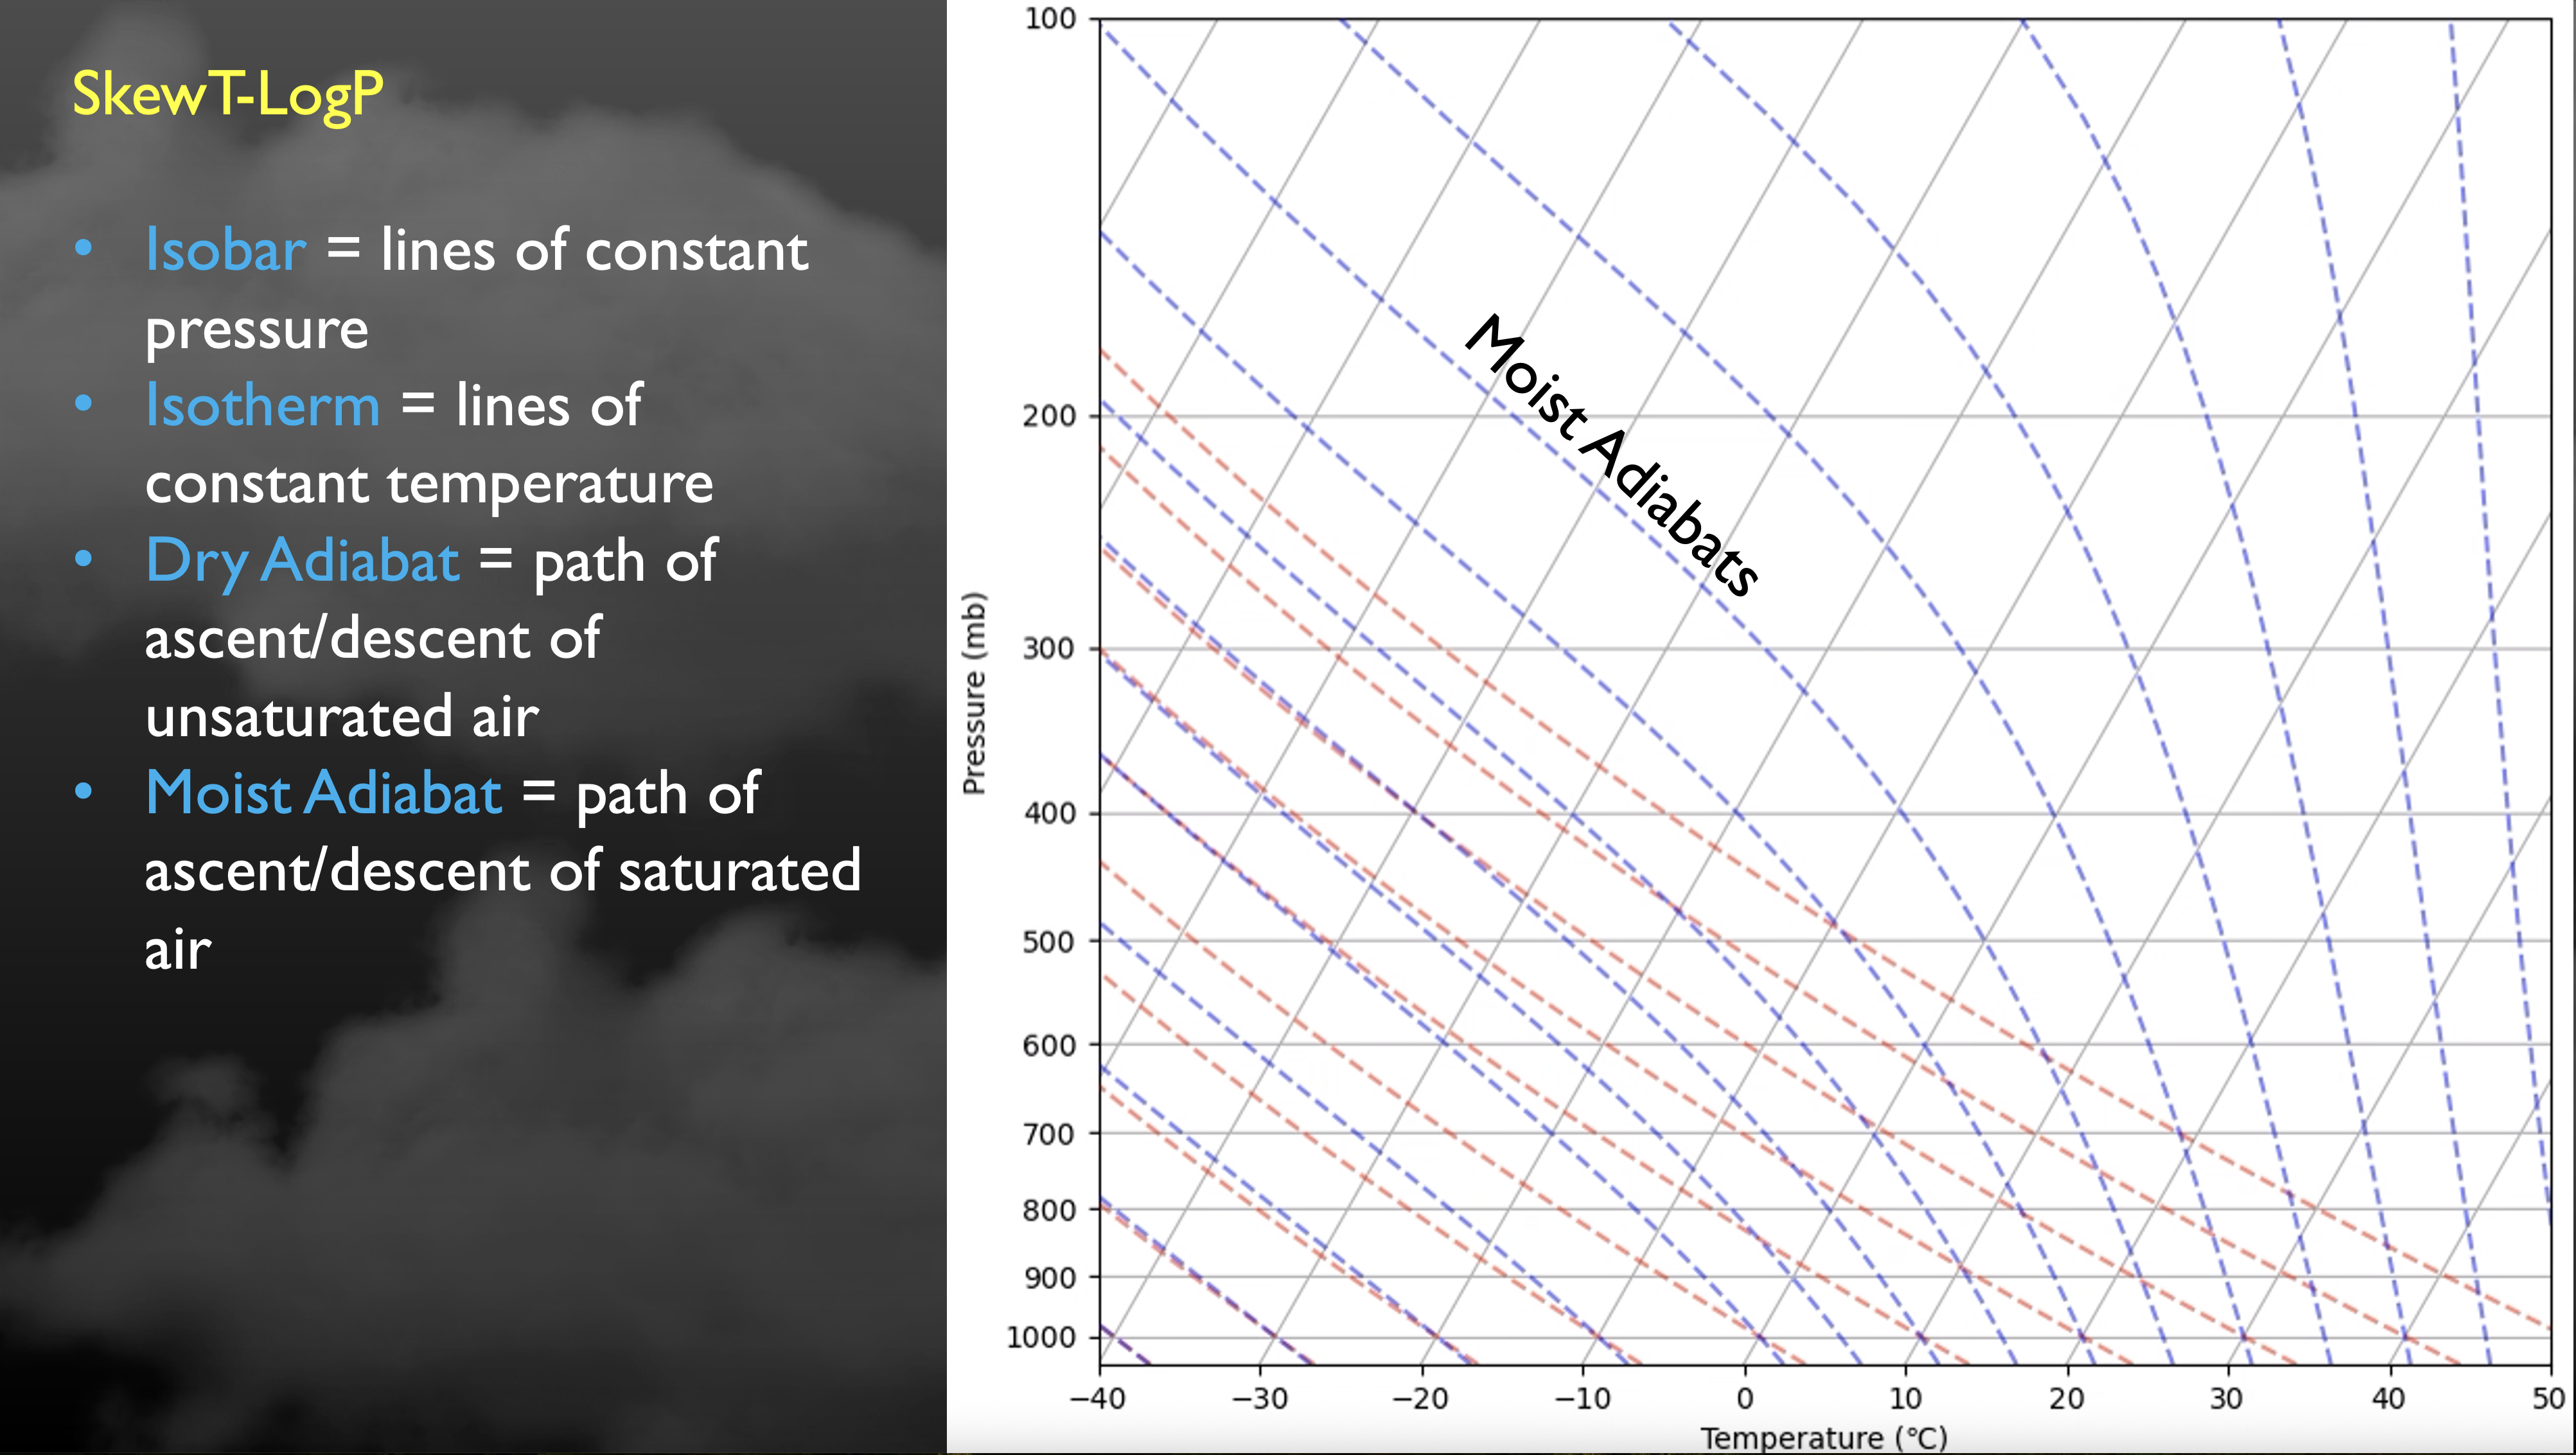
Figure 3. Skew-T with isobars, isotherms, and the dry & moist adiabatic lapse rates
Note that at cold temperatures there is almost no difference between the dry and moist adiatic lapse rates. But at warmer temperatures, the moist adiabatic lapse rate is far less than the dry adiabatic lapse rate (which is constant). In other words, at warm temperatures air that is saturated will cool much more slowly than a parcel that is unsaturated.
The reason is moisture. The next lines of interest are the mixing ratio lines. The mixing ratio is simply how much water vapor a parcel can hold at different temperatures. Or put another way, what is that number in grams per kilogram at saturation for a given temperature? For a temperature of -18°C (0°F), that is 1 g/kg.
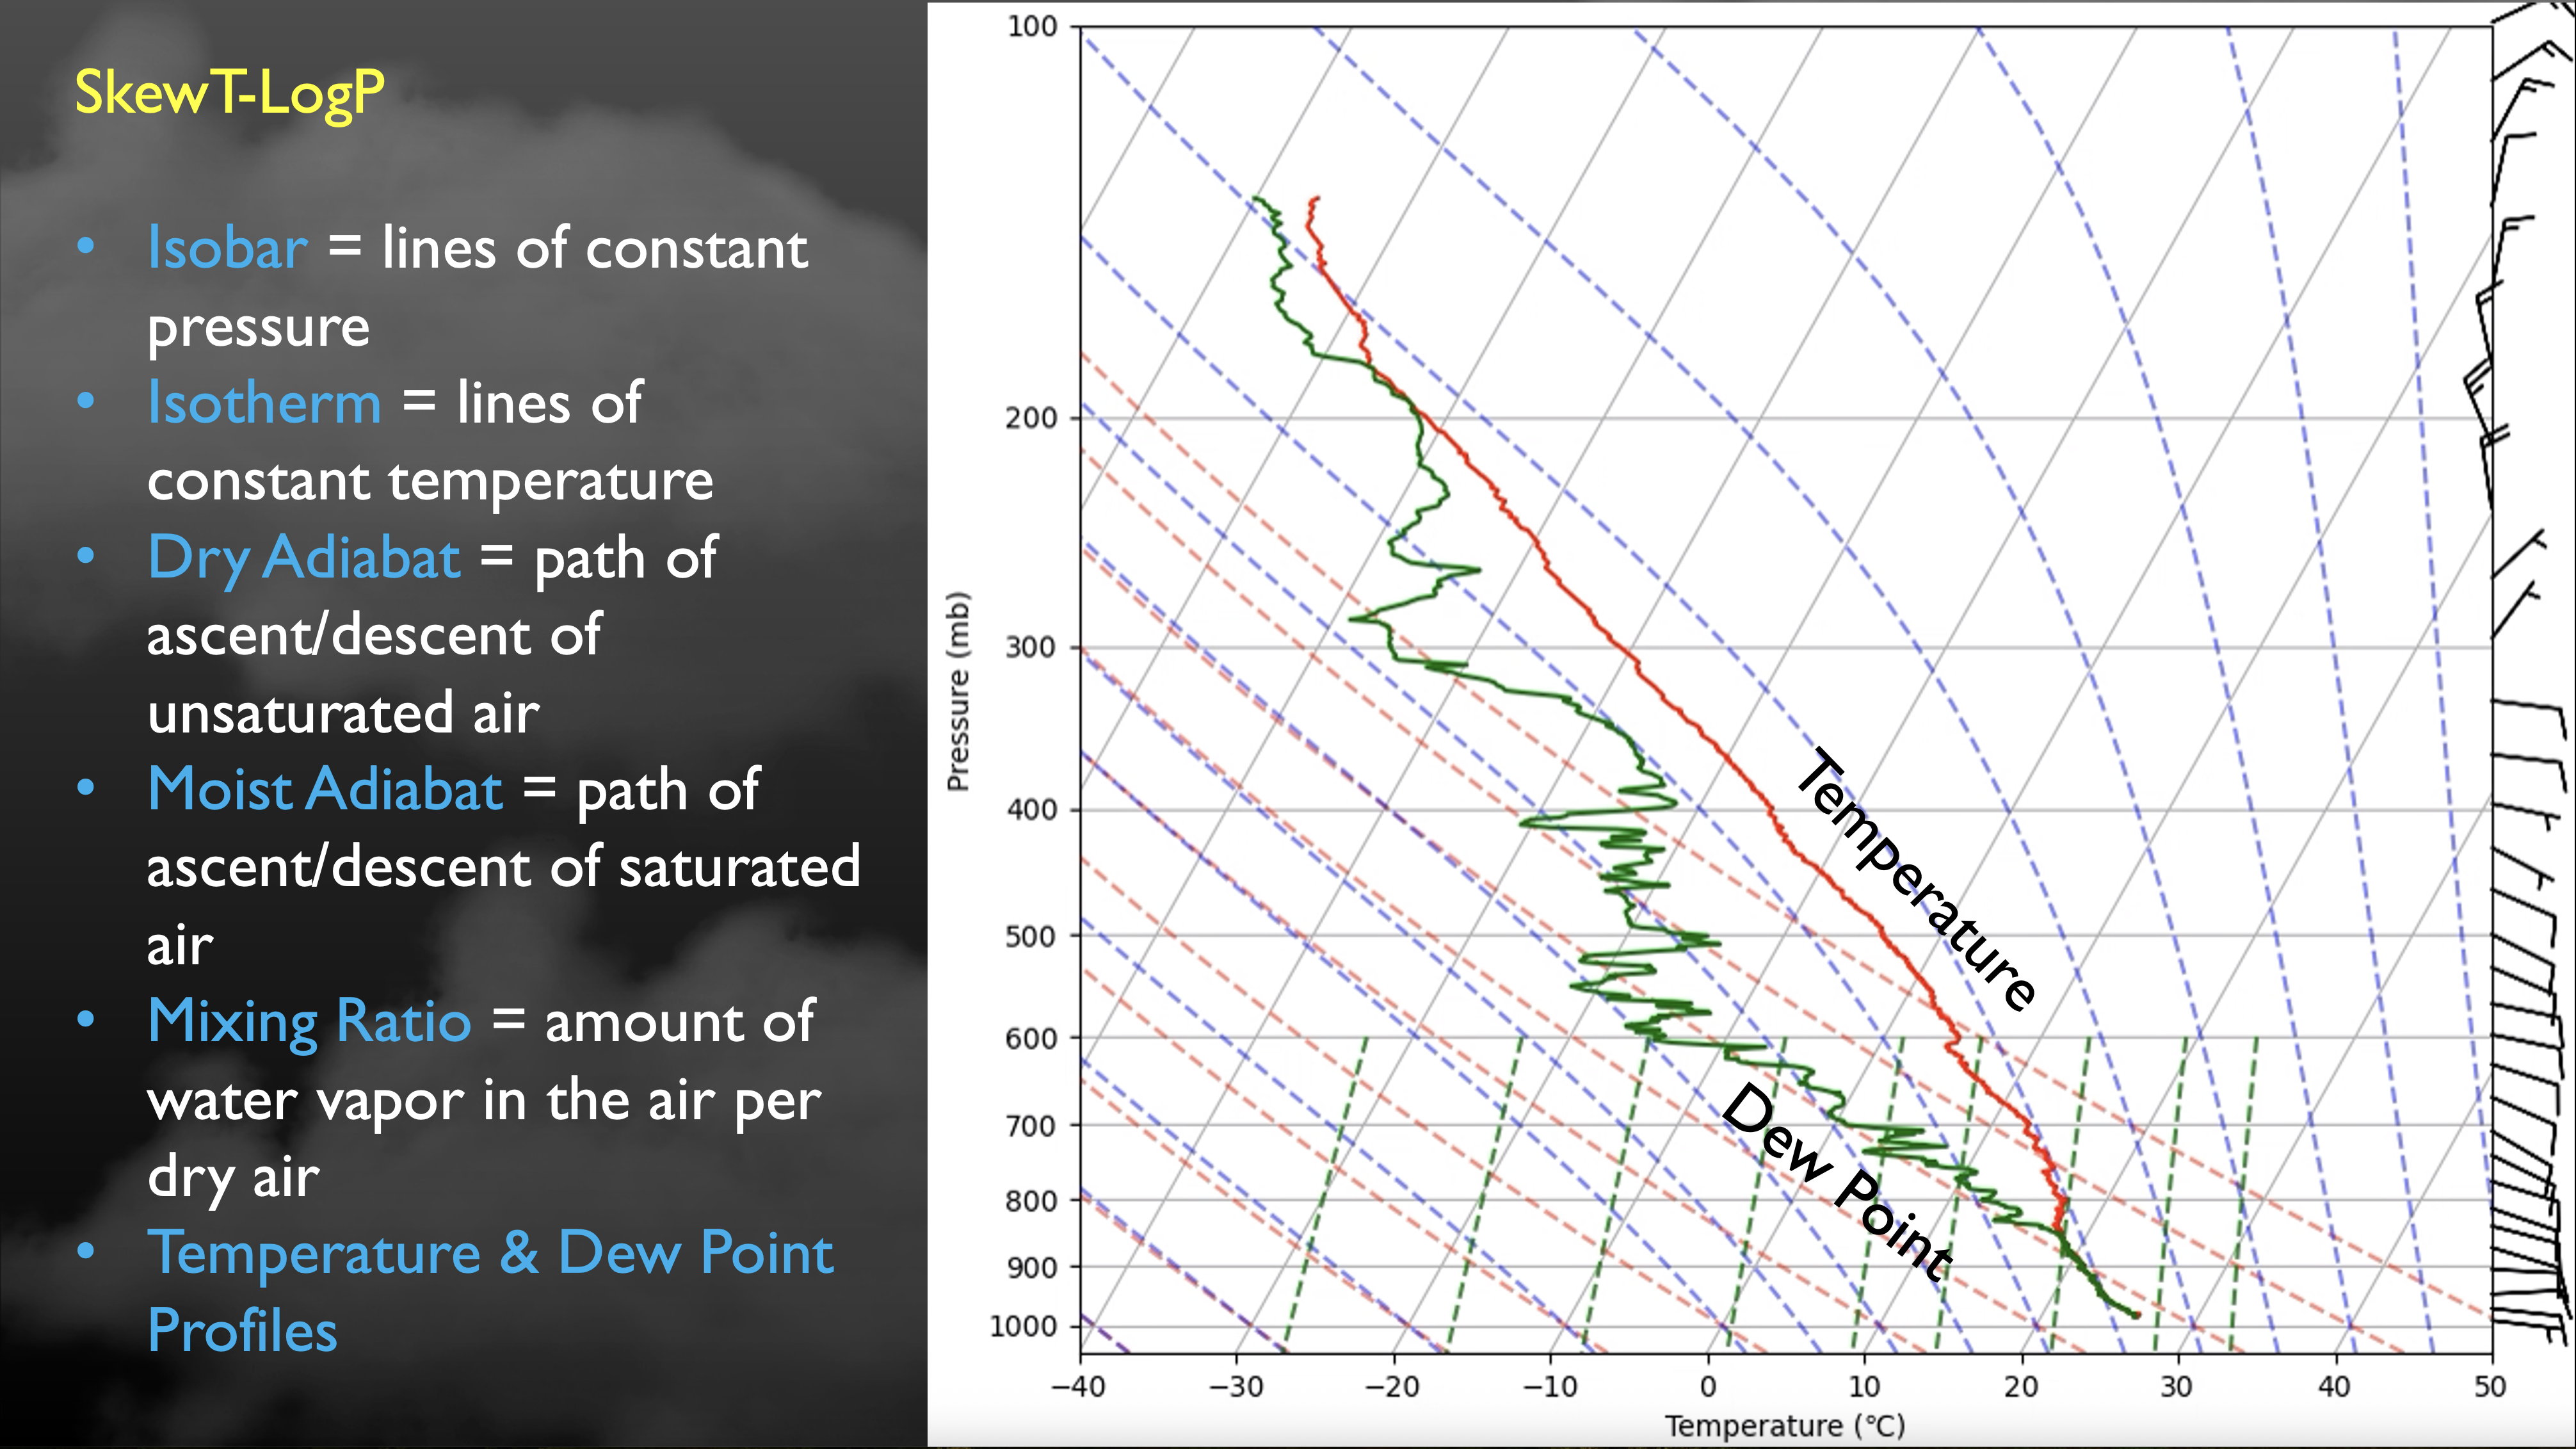
Figure 4. Skew-T with environmental profiles
Calculate humidity
We also can use mixing ratio to calculate relative humidity. To get that let's assume the temperature is -10°C (14°F) and the dewpoint is -15°C (5°F). We then see that that the saturation mixing ratio for the air temperature is 2 g/kg (es) and for the dewpoint it is 1.5 g/kg (e).
RH= actual vapor pressure (e) / saturation vapor pressure (es). So, 1.5/2.0 = 75% relative humidity.
Now let's consider one in the summer on a very hot, miserable day when the air temperature is 95°F (35°C) and the dew point is 77°F (25°C). In this the saturation mixing ratio for the air temperature is 40 g/kg (es) and for the dewpoint it is 20 g/kg (e).
RH= actual vapor pressure (e) / saturation vapor pressure (es). So, 20/40 = 50% relative humidity.
This is why relative humidity as a term deserves context. No one in their right mind would say the 75% humidity on the cold day feels more humid than the summer afternoon even though it is technically higher. This is why using dew point and wet bulb temperature are much better indicators of how humid it actually feels.
Severe weather
The reason we care so much about moisture is it affects whether an air parcel will sink or rise. We determine this by going to the dewpoint and then following the mixing ratio until it meets the dry adiabatic lapse rate. We call this the lifted condensation level (LCL). If the dewpoint is much lower than the temperature, this will occur much higher up in the atmosphere. If the dew point is almost equal to the temperature, this will be a little above the surface. Once the parcel reaches the LCL, it will cool at the moist adiabatic lapse rate.
If the air parcel is cooler than the environmental temperature, it will sink.
If the air parcel is warmer than the environmental temperature, it will rise.
Winds changing direction and increasing in speed with height can indicate higher risk of severe thunderstorms because they will help the storm capture the tilt it needs to keep the warm, moist inflow to the storm separate from the outflow of a storm.
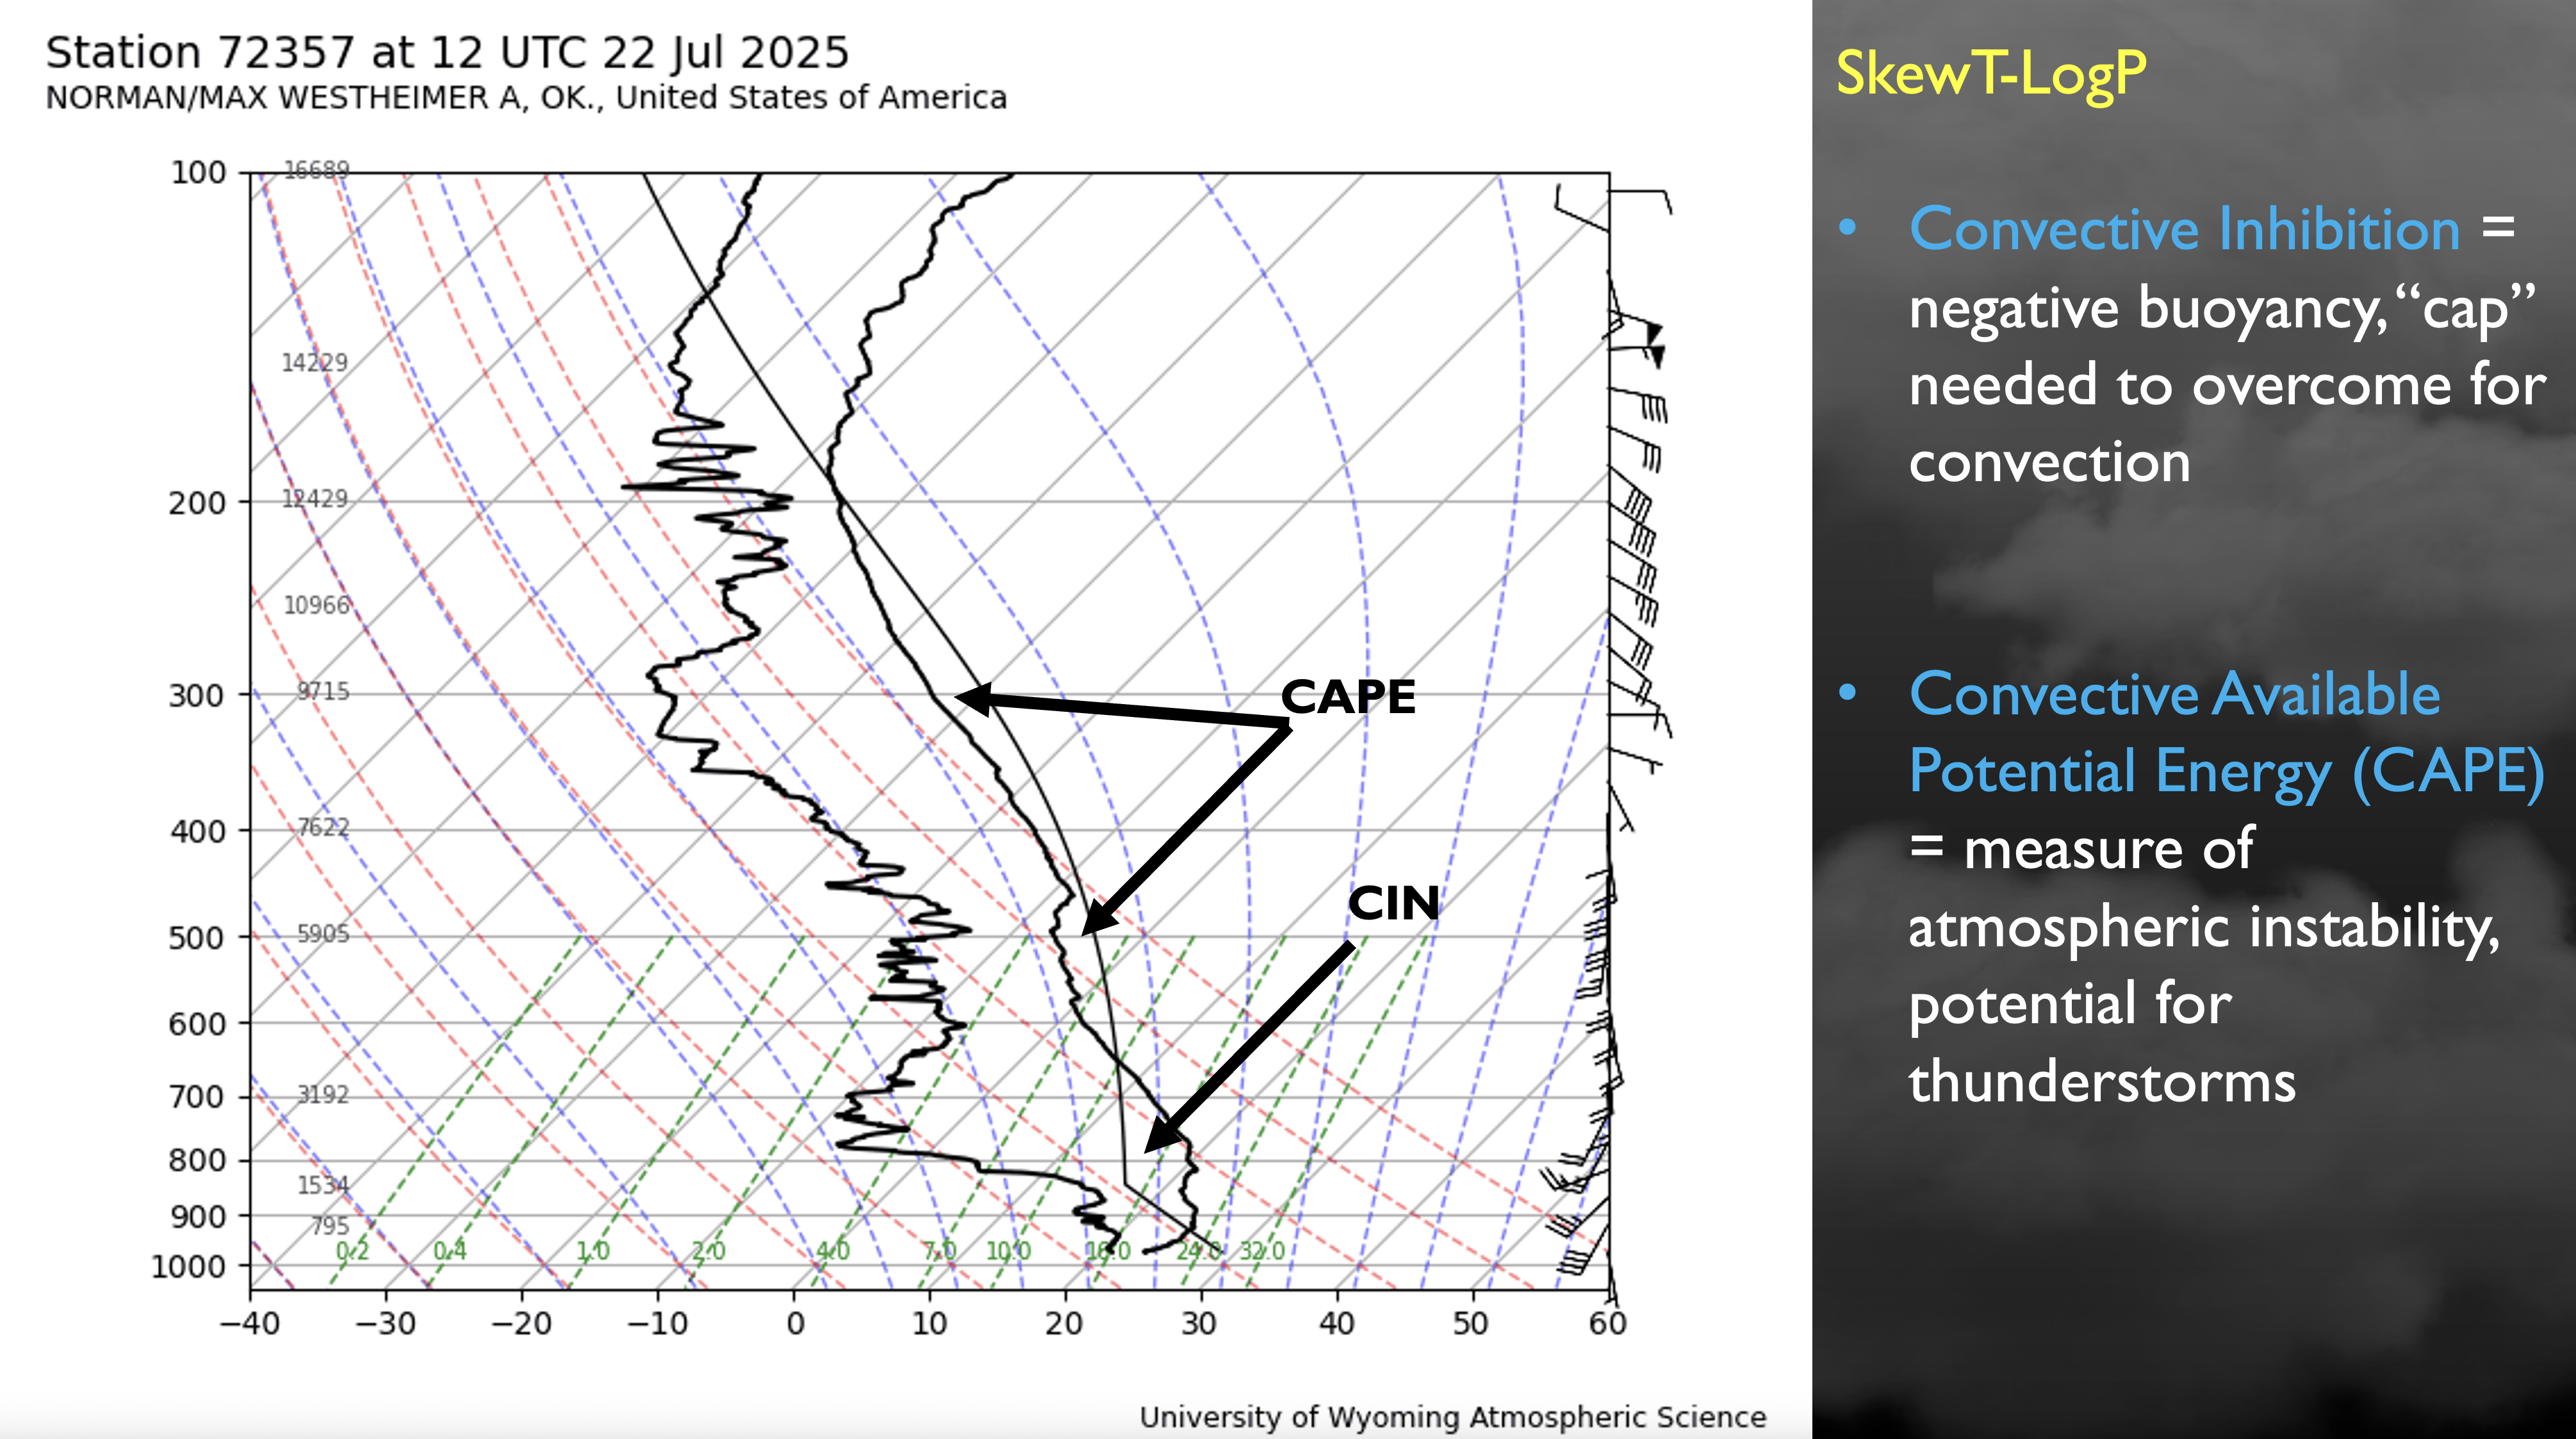
Figure 5. Skew-T with environmental profile and noting locations of CAPE and CIN.
Convective Available Potential Energy (CAPE) is the amount of buoyant energy available to accelerate an air parcel upward once it reaches its Level of Free Convection (LFC). It is one of the most useful quantities derived from a Skew-T/log-P diagram for assessing atmospheric instability and thunderstorm potential. CAPE is expressed in joules per kilogram (J kg⁻¹). NOAA . Think of it as fuel for rain and thunderstorms.
The higher the CAPE, the more explosive storms can be. A warming planet that has more moisture also can mean more CAPE, which is why we are concerned about severe weather.
Physical meaning of CAPE
Imagine lifting a parcel from near the surface. Initially, the parcel may need forced lifting because it is colder/denser than its environment. Eventually it may reach the LFC, where it becomes warmer than the surrounding atmosphere. Above the LFC, the parcel has positive buoyancy and can accelerate upward without additional forcing.
On a Skew-T, CAPE corresponds to the positive area where the parcel temperature trace lies to the right (warmer side) of the environmental temperature trace, generally between the LFC and EL.
How to find CAPE on a Skew-T
Suppose you start with a surface parcel.
- Locate the parcel's starting temperature and dewpoint. These determine the initial thermodynamic properties of the parcel.
- Lift the parcel dry adiabatically from its starting temperature.
- At the same time, follow the parcel's mixing-ratio line upward from its dewpoint.
- Where those two paths intersect is approximately the LCL—the level where the parcel becomes saturated.
- Above the LCL, lift the parcel along a moist/pseudoadiabatic path.
- Find where that parcel path first becomes warmer than the environment. This is the LFC.
- Continue following the parcel upward until its temperature becomes equal to the environmental temperature again. This is the EL.
- The integrated positive buoyancy between the LFC and EL is CAPE.
Do we need to repent?
First off, no one needs to worry about repenting! I am talking about convective inhibition, not something regarding religion. Convective Inhibition (CIN) is the amount of energy that must be overcome to lift an air parcel from its starting level to the LFC. Before reaching the LFC, there may be a layer where the rising parcel is colder and denser than its environment. Because the parcel is negatively buoyant, it naturally wants to sink rather than continue rising. You can think of CIN as the atmosphere's “cap” that suppresses convection.
Some amount of CIN is needed for storms to achieve severe limits. Indeed, the worst outbreaks have some amount of CIN to overcome. Climate change can lead to more big severe weather outbreaks if high CAPE and moderate to high CIN coincide. Indeed, recent research has shown there are likely to be more severe storms and fewer garden variety storms.
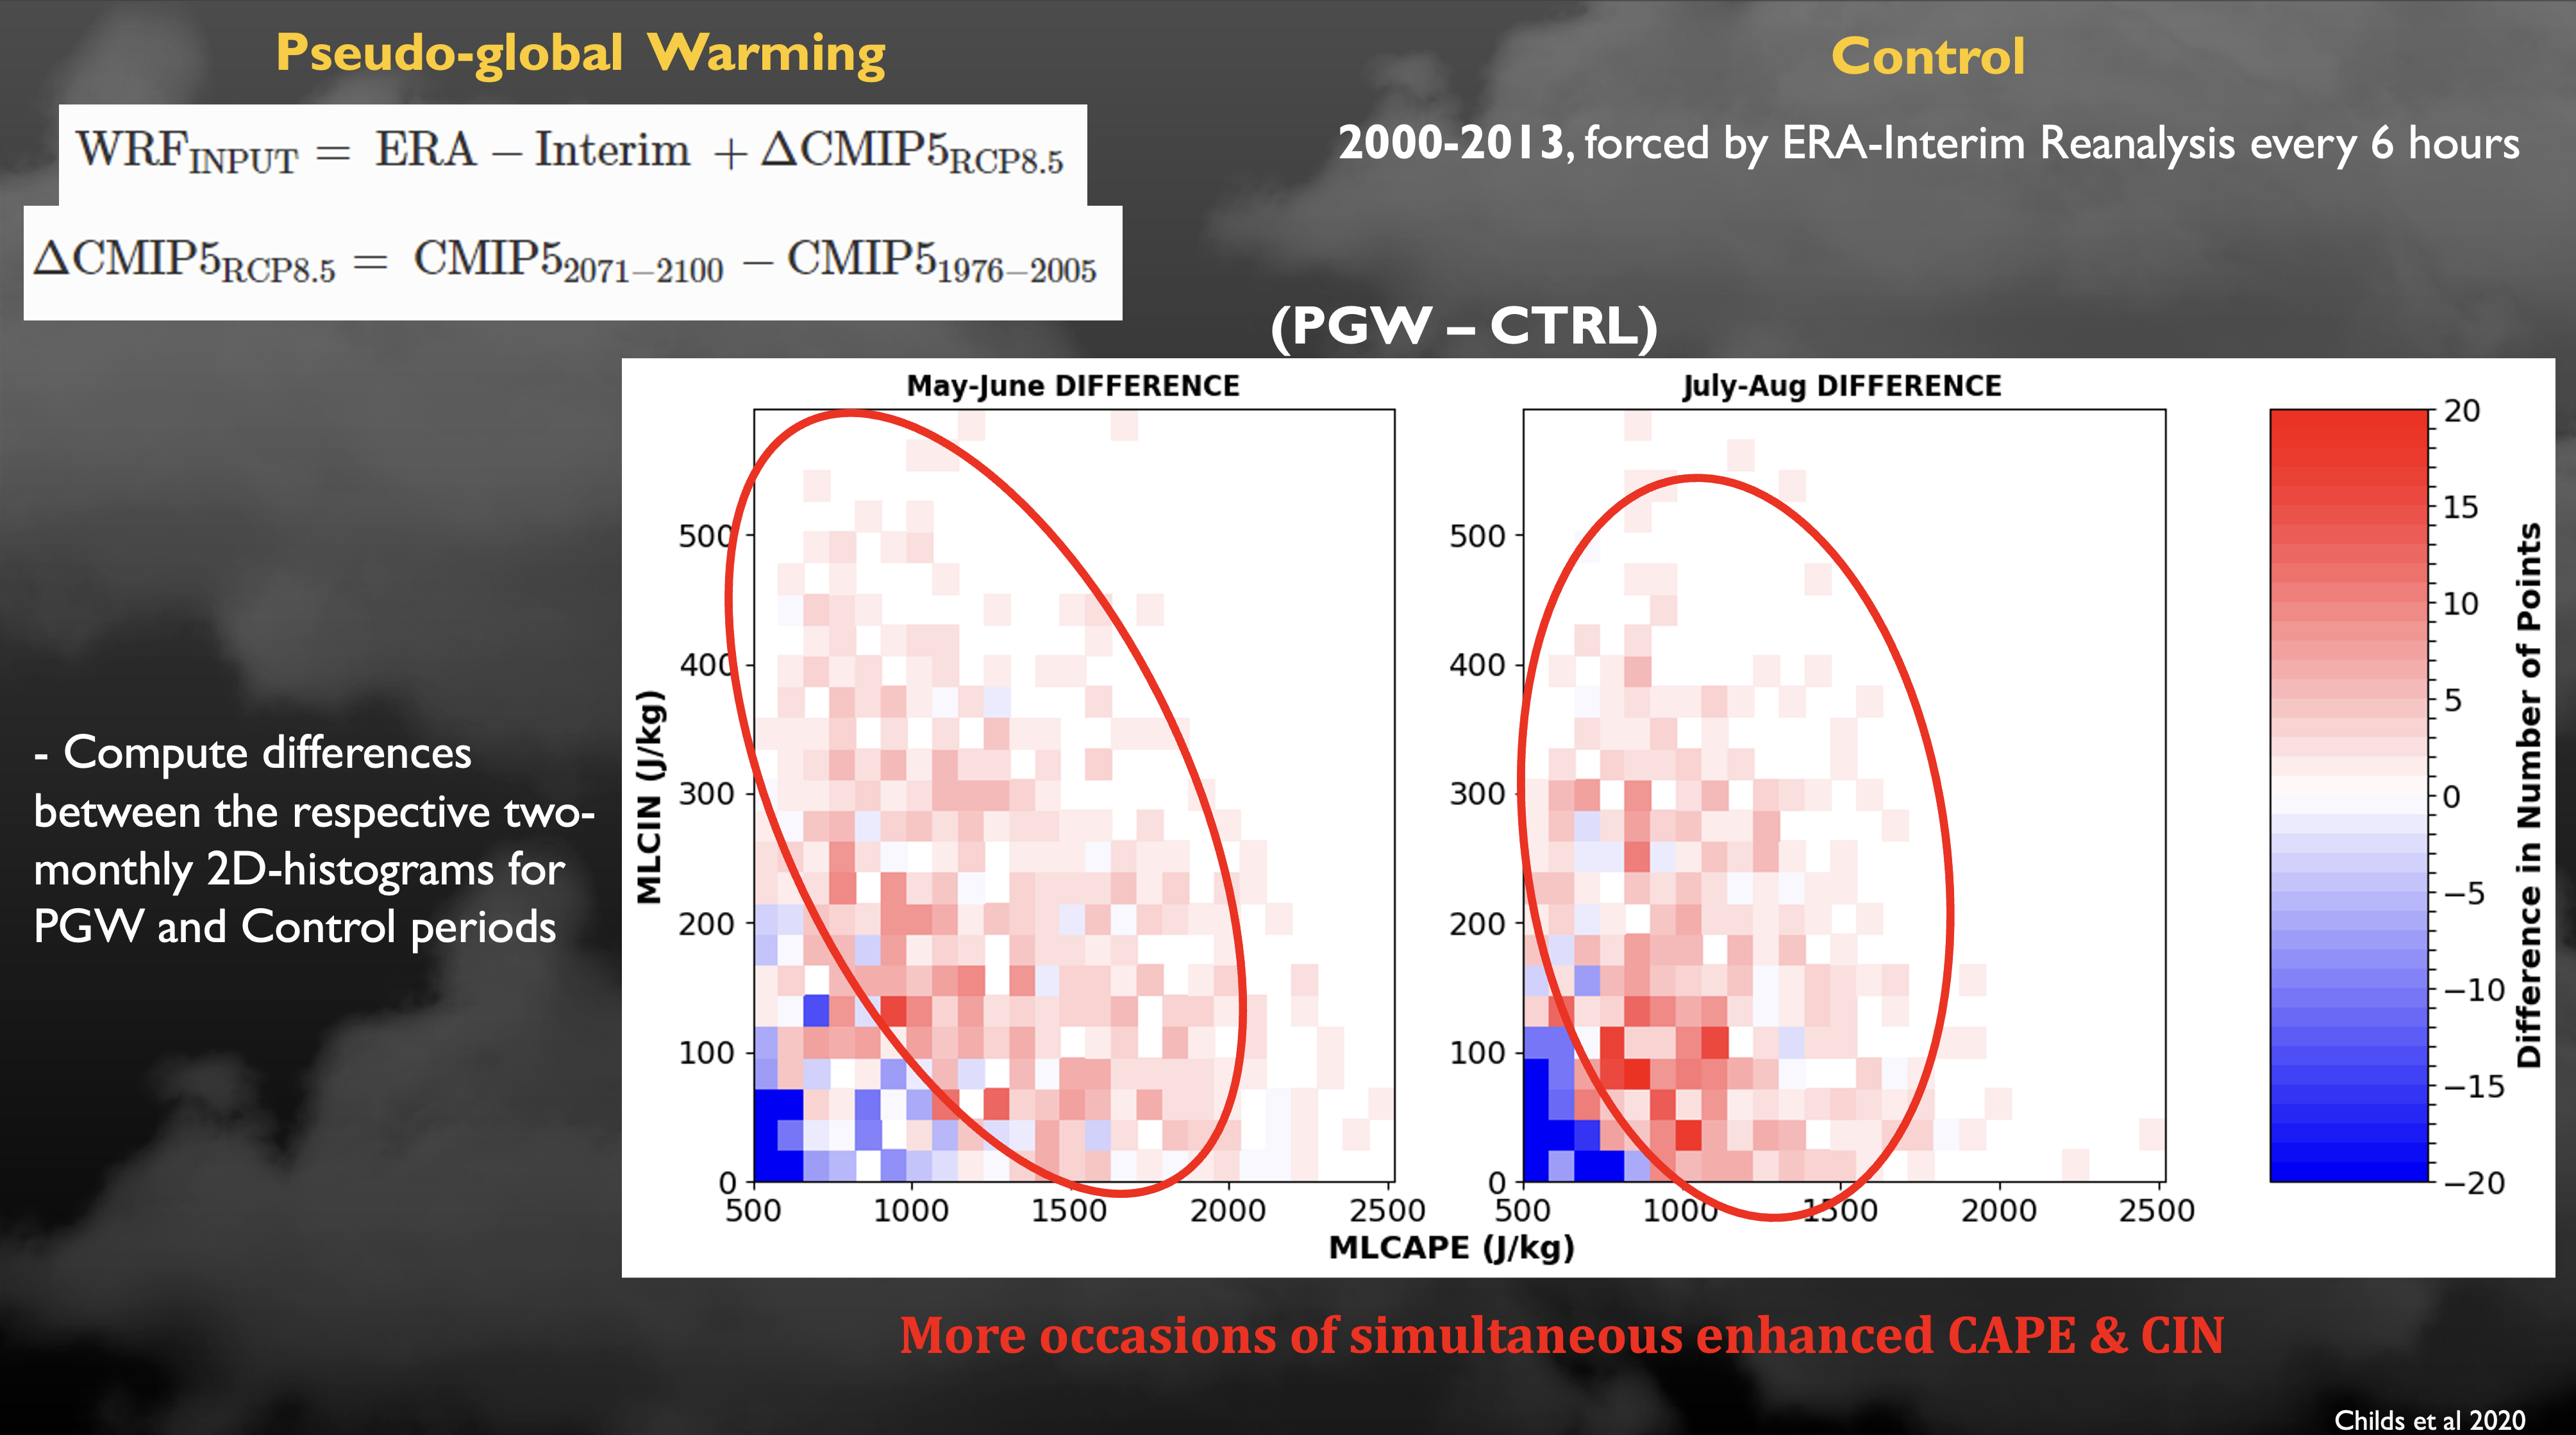
Figure 6. Figure from Childs et al. 2020


