
Greenhouse gas absorption
In the climate literacy quiz, there was a multiple choice question about which greenhouse gas was most important in terms of overall abundance. Many of you selected either carbon dioxide (CO2) or methane CH4) instead of water vapor. This is a logical answer and both are important greenhouse gases. But the greenhouse gas that is most truly abundant is water vapor.

Figure 1. Absorption spectrum of various greenhouse gases
In Figure 1 we see absorption from water vapor is dominant throughout the longwave/infrared portion of the spectrum. Carbon dioxide is also a good absorber but in far fewer spots. But it is a very good absorber of energy in the Earth's peak longwave emission. Thus, over the course of Earth's history, carbon dioxide concentration and temperature have been highly correlated. The NOAA link shows the concentration of carbon dioxide as measured from Mauna Loa back to the late 1950's. Later this semester we will discuss how we can determine reasonable estimates of past carbon dioxide levels.
Can we detect recent warming from an enhanced greenhouse effect?
The short answer is yes via satellite. The cooling in the stratosphere is a strong signal that the greenhouse effect is absorbing more of Earth's outgoing longwave radiation and sending it back. Hence, the divergent signals between the warming troposphere and the cooling stratosphere.
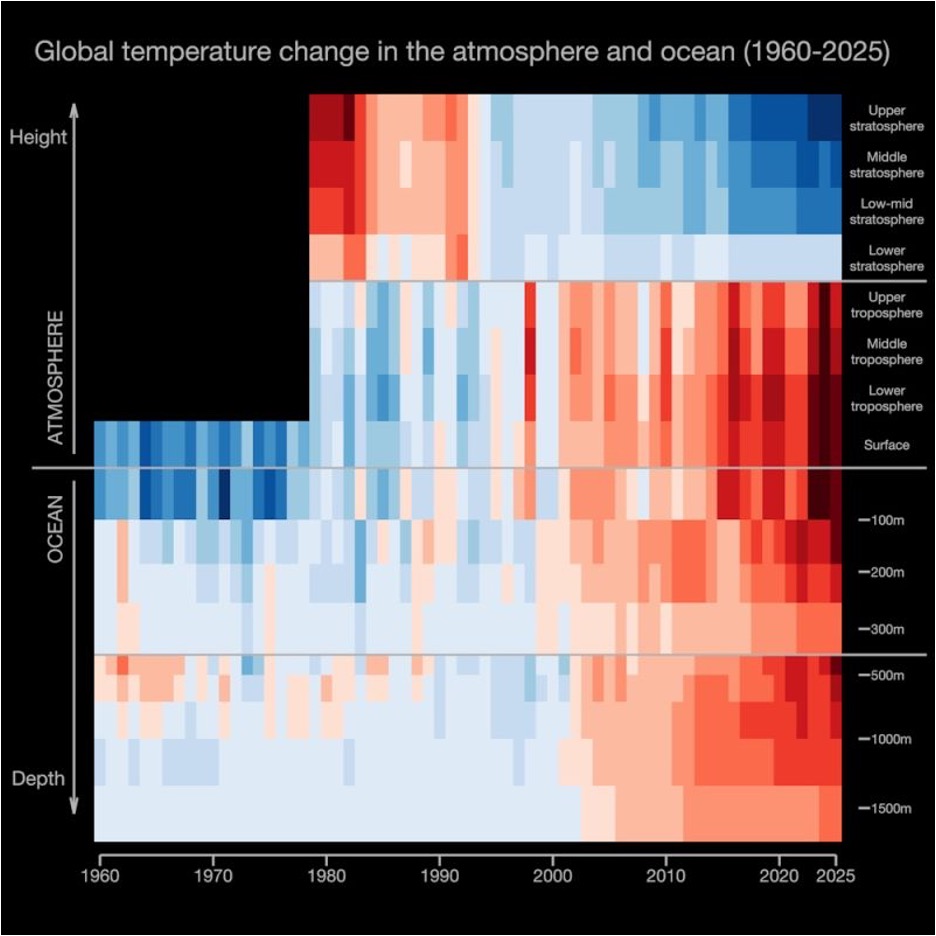
Figure 2. Temperature anomalies between the stratosphere and the deep ocean


