
Dry start to 2026
The first 17 weeks of 2026 have not been kind to most Nebraska in terms of moisture and drought development/intensification. Parts of southeast Nebraska around Auburn and Nebraska City are running above average (Figure 1) and these areas are free and clear of drought and abnormal dryness on the U.S. Drought Monitor. But most of the state is running at least a 2.5" deficit year to date (Table 1) and received less than 75 percent of average precipitation during that time. The western half of the state generally is running less than 50 percent of average and the area around Curtis is running less than 25 percent of average.
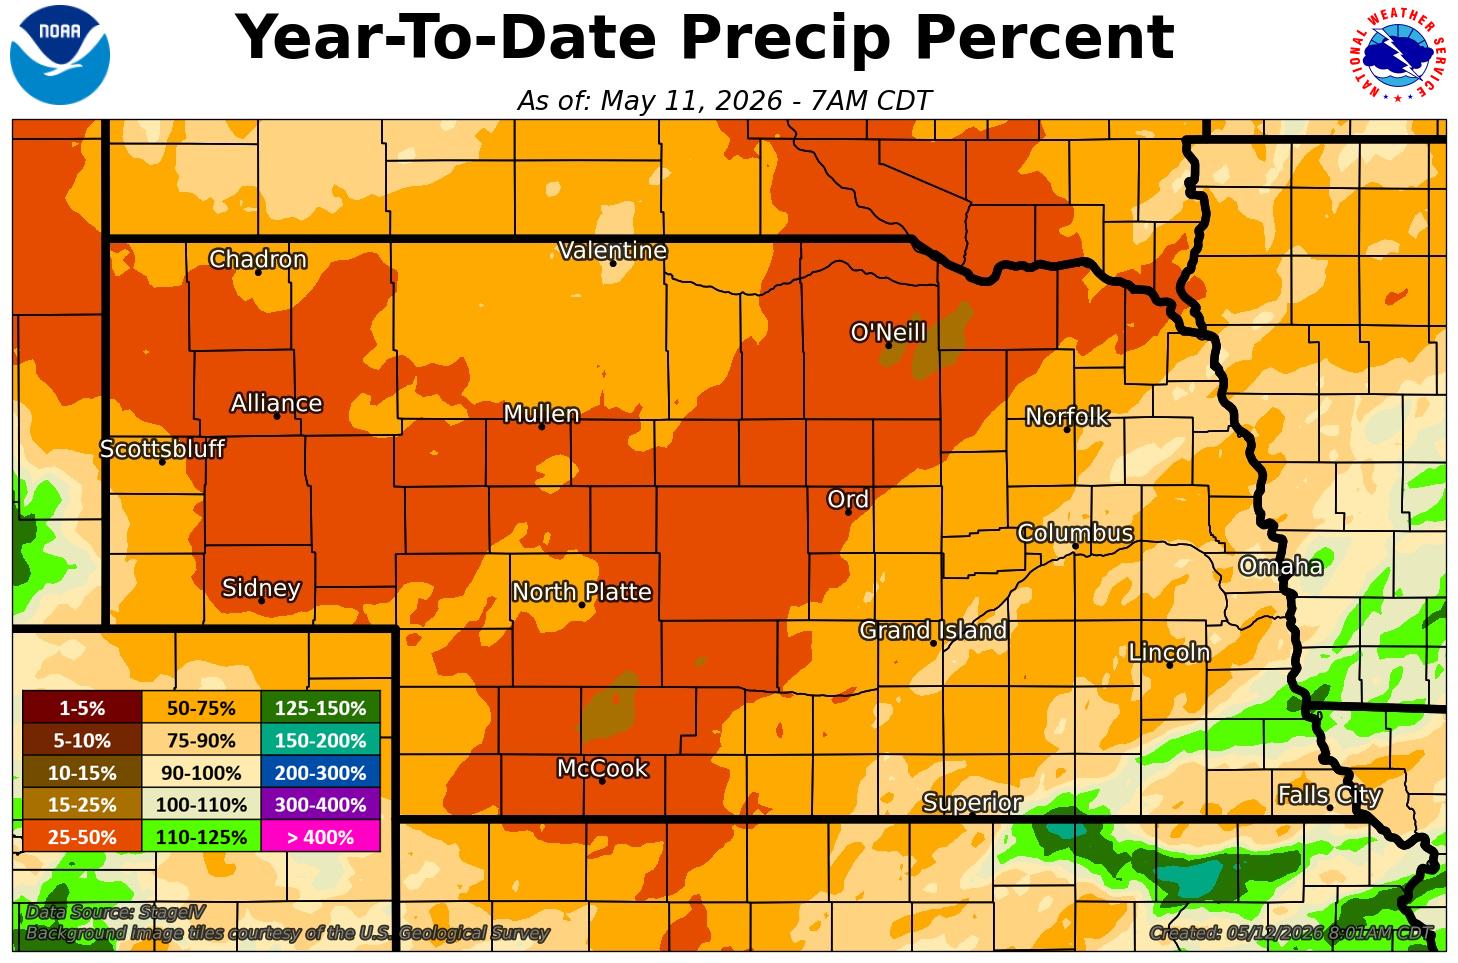
Figure 1. Percent of average precipitation. Figure courtesy of the Hastings NWS office.
For stations with no days of precipitation reports missing in 2026, Johnson 1.7 E has been wettest with 9.07". Culbertson 2.0 E has been driest with only 1.01". Table 1 (below) shows the year to date totals and deficits at ASOS stations so far in 2026.
| Location | YTD Precip (inches) | YTD Anomaly (inches) |
| Omaha | 5.74 | -2.47 |
| Lincoln | 4.08 | -3.39 |
| Norfolk | 3.96 | -2.86 |
| Grand Island | 2.75 | -3.86 |
| Hastings | 4.07 | -2.58 |
| Ord | 1.80 | -4.35 |
| North Platte | 2.02 | -3.21 |
| Broken Bow | 1.79 | -4.06 |
| McCook | 1.03 | -3.15 |
| Valentine | 2.69 | -2.82 |
| Scottsbluff | 1.68 | -3.06 |
| Alliance | 1.31 | -2.37 |
| Chadron | 1.73 | -2.41 |


